
Advertisement
Some say volatility, rather than debt, is the best way to think about risk as an investor, but Warren Buffett famously said that 'Volatility is far from synonymous with risk.' It's only natural to consider a company's balance sheet when you examine how risky it is, since debt is often involved when a business collapses. We can see that Kaltura, Inc. (NASDAQ:KLTR) does use debt in its business. But the real question is whether this debt is making the company risky.
What Risk Does Debt Bring?
Debt assists a business until the business has trouble paying it off, either with new capital or with free cash flow. Ultimately, if the company can't fulfill its legal obligations to repay debt, shareholders could walk away with nothing. However, a more frequent (but still costly) occurrence is where a company must issue shares at bargain-basement prices, permanently diluting shareholders, just to shore up its balance sheet. Of course, plenty of companies use debt to fund growth, without any negative consequences. When we examine debt levels, we first consider both cash and debt levels, together.
See our latest analysis for Kaltura
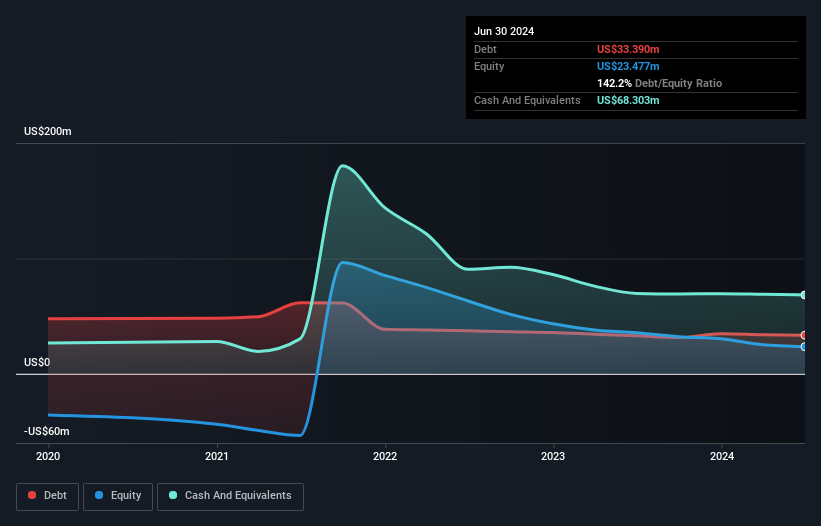
How Much Debt Does Kaltura Carry?
As you can see below, Kaltura had US$33.4m of debt, at June 2024, which is about the same as the year before. You can click the chart for greater detail. However, it does have US$68.3m in cash offsetting this, leading to net cash of US$34.9m.
How Strong Is Kaltura's Balance Sheet?
The latest balance sheet data shows that Kaltura had liabilities of US$98.5m due within a year, and liabilities of US$49.3m falling due after that. Offsetting this, it had US$68.3m in cash and US$22.1m in receivables that were due within 12 months. So its liabilities outweigh the sum of its cash and (near-term) receivables by US$57.4m.
This deficit isn't so bad because Kaltura is worth US$189.2m, and thus could probably raise enough capital to shore up its balance sheet, if the need arose. But we definitely want to keep our eyes open to indications that its debt is bringing too much risk. Despite its noteworthy liabilities, Kaltura boasts net cash, so it's fair to say it does not have a heavy debt load! There's no doubt that we learn most about debt from the balance sheet. But ultimately the future profitability of the business will decide if Kaltura can strengthen its balance sheet over time. So if you want to see what the professionals think, you might find this free report on analyst profit forecasts to be interesting.
In the last year Kaltura wasn't profitable at an EBIT level, but managed to grow its revenue by 2.6%, to US$177m. We usually like to see faster growth from unprofitable companies, but each to their own.
So How Risky Is Kaltura?
By their very nature companies that are losing money are more risky than those with a long history of profitability. And in the last year Kaltura had an earnings before interest and tax (EBIT) loss, truth be told. And over the same period it saw negative free cash outflow of US$1.1m and booked a US$44m accounting loss. While this does make the company a bit risky, it's important to remember it has net cash of US$34.9m. That kitty means the company can keep spending for growth for at least two years, at current rates. Overall, we'd say the stock is a bit risky, and we're usually very cautious until we see positive free cash flow. When analysing debt levels, the balance sheet is the obvious place to start. However, not all investment risk resides within the balance sheet - far from it. Case in point: We've spotted 3 warning signs for Kaltura you should be aware of.
At the end of the day, it's often better to focus on companies that are free from net debt. You can access our special list of such companies (all with a track record of profit growth). It's free.
Valuation is complex, but we're here to simplify it.
Discover if Kaltura might be undervalued or overvalued with our detailed analysis, featuring fair value estimates, potential risks, dividends, insider trades, and its financial condition.
Access Free AnalysisHave feedback on this article? Concerned about the content? Get in touch with us directly. Alternatively, email editorial-team (at) simplywallst.com.
This article by Simply Wall St is general in nature. We provide commentary based on historical data and analyst forecasts only using an unbiased methodology and our articles are not intended to be financial advice. It does not constitute a recommendation to buy or sell any stock, and does not take account of your objectives, or your financial situation. We aim to bring you long-term focused analysis driven by fundamental data. Note that our analysis may not factor in the latest price-sensitive company announcements or qualitative material. Simply Wall St has no position in any stocks mentioned.
About NasdaqGS:KLTR
Kaltura
Provides various software-as-a-service (SaaS) products and solutions and a platform-as-a-service (PaaS) in the United States, Europe, the Middle East, Africa, and internationally.
Flawless balance sheet and undervalued.
Similar Companies
Market Insights

Advertisement
Community Narratives
The company that turned a verb into a global necessity and basically runs the modern internet, digital ads, smartphones, maps, and AI.
Fair Value US$300.00|5.1% undervalued
OS
Community Contributor
Flowers Foods Pays A Fair Price For Health
Fair Value US$16.12|27.7% undervalued
NV
Community Contributor
TMX Group will thrive with 33.3% profit margin and enduring market moat
Fair Value CA$49.90|0.2% overvalued
LI
Community Contributor
The "Molecular Pencil": Why Beam's Technology is Built to Win
Fair Value US$65.01|64.4% undervalued
DA
Community Contributor