
Advertisement
- United States
- /
- Software
- /
- NasdaqCM:ANY
A Piece Of The Puzzle Missing From Sphere 3D Corp.'s (NASDAQ:ANY) 26% Share Price Climb
Those holding Sphere 3D Corp. (NASDAQ:ANY) shares would be relieved that the share price has rebounded 26% in the last thirty days, but it needs to keep going to repair the recent damage it has caused to investor portfolios. The bad news is that even after the stocks recovery in the last 30 days, shareholders are still underwater by about 9.3% over the last year.
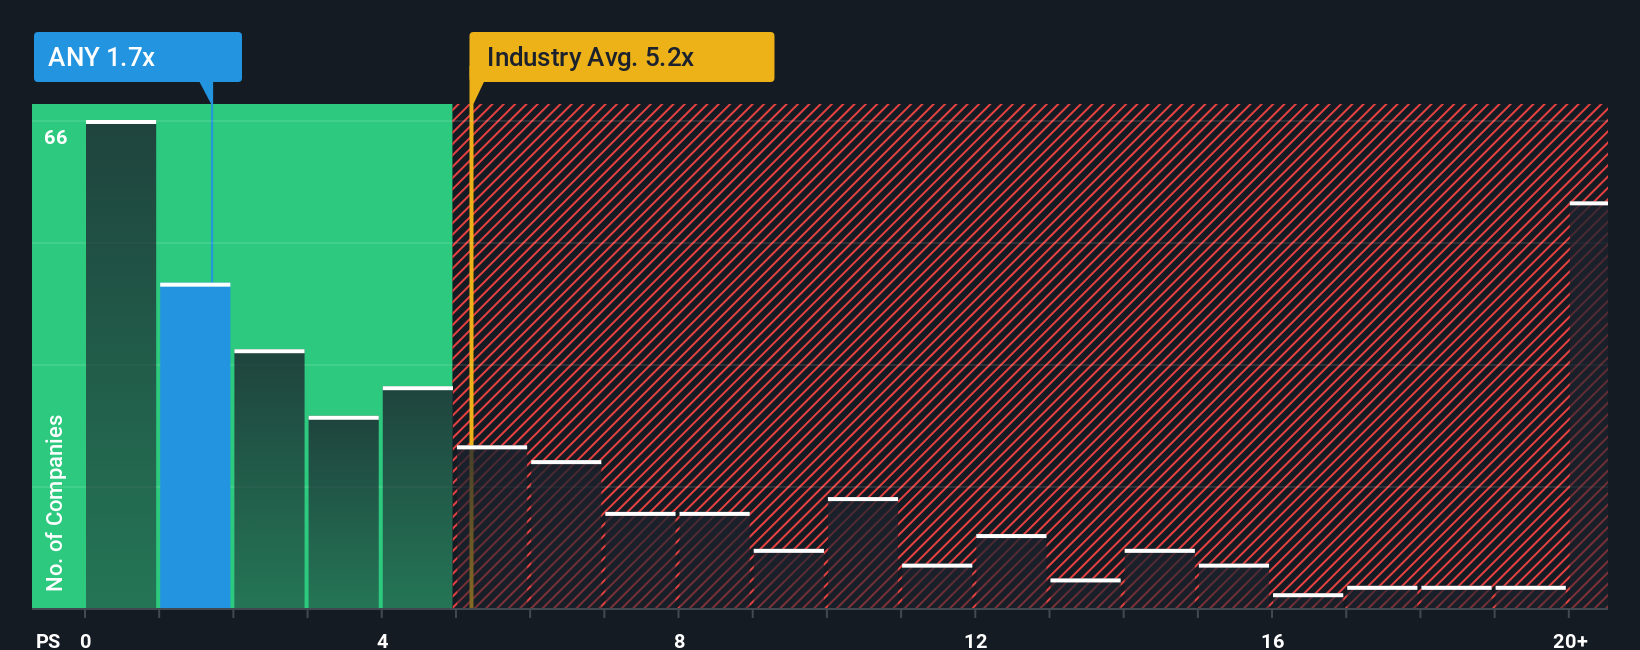
Even after such a large jump in price, Sphere 3D may still be sending very bullish signals at the moment with its price-to-sales (or "P/S") ratio of 1.7x, since almost half of all companies in the Software industry in the United States have P/S ratios greater than 5.2x and even P/S higher than 12x are not unusual. Nonetheless, we'd need to dig a little deeper to determine if there is a rational basis for the highly reduced P/S.
Check out our latest analysis for Sphere 3D
What Does Sphere 3D's Recent Performance Look Like?
While the industry has experienced revenue growth lately, Sphere 3D's revenue has gone into reverse gear, which is not great. It seems that many are expecting the poor revenue performance to persist, which has repressed the P/S ratio. So while you could say the stock is cheap, investors will be looking for improvement before they see it as good value.
Keen to find out how analysts think Sphere 3D's future stacks up against the industry? In that case, our free report is a great place to start.How Is Sphere 3D's Revenue Growth Trending?
Sphere 3D's P/S ratio would be typical for a company that's expected to deliver very poor growth or even falling revenue, and importantly, perform much worse than the industry.
Retrospectively, the last year delivered a frustrating 57% decrease to the company's top line. However, a few very strong years before that means that it was still able to grow revenue by an impressive 109% in total over the last three years. So we can start by confirming that the company has generally done a very good job of growing revenue over that time, even though it had some hiccups along the way.
Shifting to the future, estimates from the sole analyst covering the company suggest revenue should grow by 33% over the next year. With the industry only predicted to deliver 20%, the company is positioned for a stronger revenue result.
In light of this, it's peculiar that Sphere 3D's P/S sits below the majority of other companies. Apparently some shareholders are doubtful of the forecasts and have been accepting significantly lower selling prices.
What We Can Learn From Sphere 3D's P/S?
Even after such a strong price move, Sphere 3D's P/S still trails the rest of the industry. Typically, we'd caution against reading too much into price-to-sales ratios when settling on investment decisions, though it can reveal plenty about what other market participants think about the company.
A look at Sphere 3D's revenues reveals that, despite glowing future growth forecasts, its P/S is much lower than we'd expect. The reason for this depressed P/S could potentially be found in the risks the market is pricing in. At least price risks look to be very low, but investors seem to think future revenues could see a lot of volatility.
Don't forget that there may be other risks. For instance, we've identified 5 warning signs for Sphere 3D (3 are potentially serious) you should be aware of.
If these risks are making you reconsider your opinion on Sphere 3D, explore our interactive list of high quality stocks to get an idea of what else is out there.
New: Manage All Your Stock Portfolios in One Place
We've created the ultimate portfolio companion for stock investors, and it's free.
• Connect an unlimited number of Portfolios and see your total in one currency
• Be alerted to new Warning Signs or Risks via email or mobile
• Track the Fair Value of your stocks
Have feedback on this article? Concerned about the content? Get in touch with us directly. Alternatively, email editorial-team (at) simplywallst.com.
This article by Simply Wall St is general in nature. We provide commentary based on historical data and analyst forecasts only using an unbiased methodology and our articles are not intended to be financial advice. It does not constitute a recommendation to buy or sell any stock, and does not take account of your objectives, or your financial situation. We aim to bring you long-term focused analysis driven by fundamental data. Note that our analysis may not factor in the latest price-sensitive company announcements or qualitative material. Simply Wall St has no position in any stocks mentioned.
About NasdaqCM:ANY
Moderate risk with adequate balance sheet.
Similar Companies
Market Insights

Advertisement
Community Narratives
The company that turned a verb into a global necessity and basically runs the modern internet, digital ads, smartphones, maps, and AI.
Fair Value US$300.00|7.1% undervalued
OS
Community Contributor
Flowers Foods Pays A Fair Price For Health
Fair Value US$16.12|26.4% undervalued
NV
Community Contributor
TMX Group will thrive with 33.3% profit margin and enduring market moat
Fair Value CA$49.90|0.8% overvalued
LI
Community Contributor
The "Molecular Pencil": Why Beam's Technology is Built to Win
Fair Value US$65.01|65.8% undervalued
DA
Community Contributor