
Advertisement
- United States
- /
- Semiconductors
- /
- NasdaqGS:SLAB
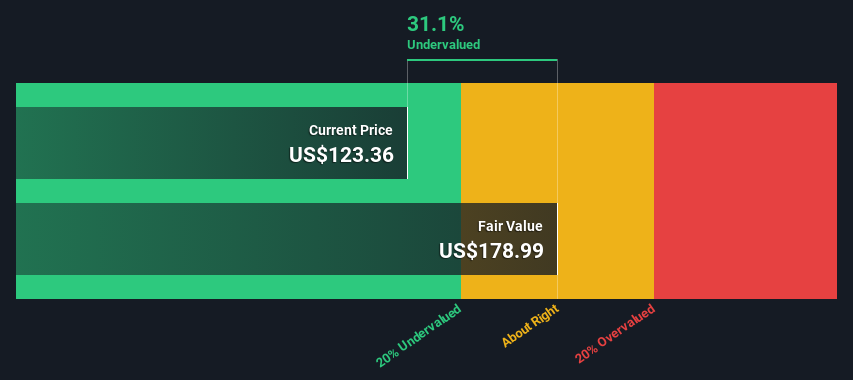
Are Investors Undervaluing Silicon Laboratories Inc. (NASDAQ:SLAB) By 31%?
Key Insights
- The projected fair value for Silicon Laboratories is US$179 based on 2 Stage Free Cash Flow to Equity
- Silicon Laboratories' US$123 share price signals that it might be 31% undervalued
- The US$135 analyst price target for SLAB is 24% less than our estimate of fair value
How far off is Silicon Laboratories Inc. (NASDAQ:SLAB) from its intrinsic value? Using the most recent financial data, we'll take a look at whether the stock is fairly priced by taking the forecast future cash flows of the company and discounting them back to today's value. Our analysis will employ the Discounted Cash Flow (DCF) model. Don't get put off by the jargon, the math behind it is actually quite straightforward.
Companies can be valued in a lot of ways, so we would point out that a DCF is not perfect for every situation. Anyone interested in learning a bit more about intrinsic value should have a read of the Simply Wall St analysis model.
View our latest analysis for Silicon Laboratories
Crunching The Numbers
We use what is known as a 2-stage model, which simply means we have two different periods of growth rates for the company's cash flows. Generally the first stage is higher growth, and the second stage is a lower growth phase. In the first stage we need to estimate the cash flows to the business over the next ten years. Where possible we use analyst estimates, but when these aren't available we extrapolate the previous free cash flow (FCF) from the last estimate or reported value. We assume companies with shrinking free cash flow will slow their rate of shrinkage, and that companies with growing free cash flow will see their growth rate slow, over this period. We do this to reflect that growth tends to slow more in the early years than it does in later years.
A DCF is all about the idea that a dollar in the future is less valuable than a dollar today, and so the sum of these future cash flows is then discounted to today's value:
10-year free cash flow (FCF) estimate
| 2024 | 2025 | 2026 | 2027 | 2028 | 2029 | 2030 | 2031 | 2032 | 2033 | |
| Levered FCF ($, Millions) | -US$28.9m | US$74.0m | US$130.2m | US$200.3m | US$277.2m | US$353.4m | US$423.8m | US$485.8m | US$538.7m | US$583.4m |
| Growth Rate Estimate Source | Analyst x4 | Analyst x4 | Est @ 75.97% | Est @ 53.84% | Est @ 38.36% | Est @ 27.51% | Est @ 19.93% | Est @ 14.61% | Est @ 10.90% | Est @ 8.29% |
| Present Value ($, Millions) Discounted @ 8.7% | -US$26.6 | US$62.7 | US$101 | US$144 | US$183 | US$214 | US$237 | US$250 | US$255 | US$254 |
("Est" = FCF growth rate estimated by Simply Wall St)
Present Value of 10-year Cash Flow (PVCF) = US$1.7b
The second stage is also known as Terminal Value, this is the business's cash flow after the first stage. The Gordon Growth formula is used to calculate Terminal Value at a future annual growth rate equal to the 5-year average of the 10-year government bond yield of 2.2%. We discount the terminal cash flows to today's value at a cost of equity of 8.7%.
Terminal Value (TV)= FCF2033 × (1 + g) ÷ (r – g) = US$583m× (1 + 2.2%) ÷ (8.7%– 2.2%) = US$9.2b
Present Value of Terminal Value (PVTV)= TV / (1 + r)10= US$9.2b÷ ( 1 + 8.7%)10= US$4.0b
The total value, or equity value, is then the sum of the present value of the future cash flows, which in this case is US$5.7b. In the final step we divide the equity value by the number of shares outstanding. Relative to the current share price of US$123, the company appears quite undervalued at a 31% discount to where the stock price trades currently. Valuations are imprecise instruments though, rather like a telescope - move a few degrees and end up in a different galaxy. Do keep this in mind.
Important Assumptions
We would point out that the most important inputs to a discounted cash flow are the discount rate and of course the actual cash flows. You don't have to agree with these inputs, I recommend redoing the calculations yourself and playing with them. The DCF also does not consider the possible cyclicality of an industry, or a company's future capital requirements, so it does not give a full picture of a company's potential performance. Given that we are looking at Silicon Laboratories as potential shareholders, the cost of equity is used as the discount rate, rather than the cost of capital (or weighted average cost of capital, WACC) which accounts for debt. In this calculation we've used 8.7%, which is based on a levered beta of 1.292. Beta is a measure of a stock's volatility, compared to the market as a whole. We get our beta from the industry average beta of globally comparable companies, with an imposed limit between 0.8 and 2.0, which is a reasonable range for a stable business.
SWOT Analysis for Silicon Laboratories
Strength
- Debt is well covered by earnings.
Weakness
- Earnings declined over the past year.
Opportunity
- Trading below our estimate of fair value by more than 20%.
Threat
- Debt is not well covered by operating cash flow.
- Annual earnings are forecast to decline for the next 3 years.
Moving On:
Whilst important, the DCF calculation shouldn't be the only metric you look at when researching a company. DCF models are not the be-all and end-all of investment valuation. Instead the best use for a DCF model is to test certain assumptions and theories to see if they would lead to the company being undervalued or overvalued. For example, changes in the company's cost of equity or the risk free rate can significantly impact the valuation. Why is the intrinsic value higher than the current share price? For Silicon Laboratories, we've compiled three relevant aspects you should look at:
- Risks: To that end, you should learn about the 2 warning signs we've spotted with Silicon Laboratories (including 1 which can't be ignored) .
- Future Earnings: How does SLAB's growth rate compare to its peers and the wider market? Dig deeper into the analyst consensus number for the upcoming years by interacting with our free analyst growth expectation chart.
- Other Solid Businesses: Low debt, high returns on equity and good past performance are fundamental to a strong business. Why not explore our interactive list of stocks with solid business fundamentals to see if there are other companies you may not have considered!
PS. The Simply Wall St app conducts a discounted cash flow valuation for every stock on the NASDAQGS every day. If you want to find the calculation for other stocks just search here.
New: Manage All Your Stock Portfolios in One Place
We've created the ultimate portfolio companion for stock investors, and it's free.
• Connect an unlimited number of Portfolios and see your total in one currency
• Be alerted to new Warning Signs or Risks via email or mobile
• Track the Fair Value of your stocks
Have feedback on this article? Concerned about the content? Get in touch with us directly. Alternatively, email editorial-team (at) simplywallst.com.
This article by Simply Wall St is general in nature. We provide commentary based on historical data and analyst forecasts only using an unbiased methodology and our articles are not intended to be financial advice. It does not constitute a recommendation to buy or sell any stock, and does not take account of your objectives, or your financial situation. We aim to bring you long-term focused analysis driven by fundamental data. Note that our analysis may not factor in the latest price-sensitive company announcements or qualitative material. Simply Wall St has no position in any stocks mentioned.
About NasdaqGS:SLAB
Silicon Laboratories
A fabless semiconductor company, provides analog-intensive mixed-signal solutions in the United States, China, Taiwan, and internationally.
Flawless balance sheet with reasonable growth potential.
Similar Companies
Market Insights

Advertisement
Community Narratives
MicroVision will explode future revenue by 380.37% with a vision towards success
Fair Value US$60.00|98.4% undervalued
TH
Community Contributor
The Indispensable Artery for a New North American Economy
Fair Value CA$132.87|1.3% undervalued
TI
Community Contributor