
Advertisement
- United States
- /
- Semiconductors
- /
- NasdaqGS:SEDG
Revenues Working Against SolarEdge Technologies, Inc.'s (NASDAQ:SEDG) Share Price Following 29% Dive
Unfortunately for some shareholders, the SolarEdge Technologies, Inc. (NASDAQ:SEDG) share price has dived 29% in the last thirty days, prolonging recent pain. For any long-term shareholders, the last month ends a year to forget by locking in a 86% share price decline.
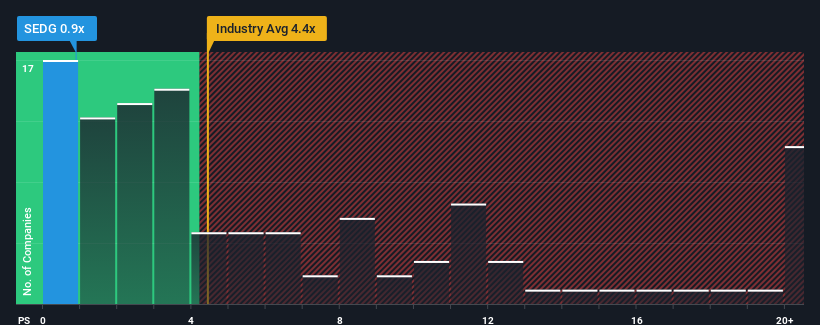
Following the heavy fall in price, SolarEdge Technologies may look like a strong buying opportunity at present with its price-to-sales (or "P/S") ratio of 0.9x, considering almost half of all companies in the Semiconductor industry in the United States have P/S ratios greater than 4.4x and even P/S higher than 12x aren't out of the ordinary. Nonetheless, we'd need to dig a little deeper to determine if there is a rational basis for the highly reduced P/S.
View our latest analysis for SolarEdge Technologies
How SolarEdge Technologies Has Been Performing
While the industry has experienced revenue growth lately, SolarEdge Technologies' revenue has gone into reverse gear, which is not great. The P/S ratio is probably low because investors think this poor revenue performance isn't going to get any better. If this is the case, then existing shareholders will probably struggle to get excited about the future direction of the share price.
Keen to find out how analysts think SolarEdge Technologies' future stacks up against the industry? In that case, our free report is a great place to start.How Is SolarEdge Technologies' Revenue Growth Trending?
SolarEdge Technologies' P/S ratio would be typical for a company that's expected to deliver very poor growth or even falling revenue, and importantly, perform much worse than the industry.
Taking a look back first, the company's revenue growth last year wasn't something to get excited about as it posted a disappointing decline of 34%. Even so, admirably revenue has lifted 56% in aggregate from three years ago, notwithstanding the last 12 months. So we can start by confirming that the company has generally done a very good job of growing revenue over that time, even though it had some hiccups along the way.
Shifting to the future, estimates from the analysts covering the company suggest revenue should grow by 6.4% each year over the next three years. With the industry predicted to deliver 27% growth per annum, the company is positioned for a weaker revenue result.
With this information, we can see why SolarEdge Technologies is trading at a P/S lower than the industry. Apparently many shareholders weren't comfortable holding on while the company is potentially eyeing a less prosperous future.
The Bottom Line On SolarEdge Technologies' P/S
Shares in SolarEdge Technologies have plummeted and its P/S has followed suit. Typically, we'd caution against reading too much into price-to-sales ratios when settling on investment decisions, though it can reveal plenty about what other market participants think about the company.
As expected, our analysis of SolarEdge Technologies' analyst forecasts confirms that the company's underwhelming revenue outlook is a major contributor to its low P/S. Shareholders' pessimism on the revenue prospects for the company seems to be the main contributor to the depressed P/S. It's hard to see the share price rising strongly in the near future under these circumstances.
A lot of potential risks can sit within a company's balance sheet. You can assess many of the main risks through our free balance sheet analysis for SolarEdge Technologies with six simple checks.
If you're unsure about the strength of SolarEdge Technologies' business, why not explore our interactive list of stocks with solid business fundamentals for some other companies you may have missed.
New: Manage All Your Stock Portfolios in One Place
We've created the ultimate portfolio companion for stock investors, and it's free.
• Connect an unlimited number of Portfolios and see your total in one currency
• Be alerted to new Warning Signs or Risks via email or mobile
• Track the Fair Value of your stocks
Have feedback on this article? Concerned about the content? Get in touch with us directly. Alternatively, email editorial-team (at) simplywallst.com.
This article by Simply Wall St is general in nature. We provide commentary based on historical data and analyst forecasts only using an unbiased methodology and our articles are not intended to be financial advice. It does not constitute a recommendation to buy or sell any stock, and does not take account of your objectives, or your financial situation. We aim to bring you long-term focused analysis driven by fundamental data. Note that our analysis may not factor in the latest price-sensitive company announcements or qualitative material. Simply Wall St has no position in any stocks mentioned.
Have feedback on this article? Concerned about the content? Get in touch with us directly. Alternatively, email editorial-team@simplywallst.com
About NasdaqGS:SEDG
SolarEdge Technologies
Designs, develops, manufactures, and sells direct current (DC) optimized inverter systems for solar photovoltaic (PV) installations in the United States, Germany, the Netherlands, Italy, rest of Europe, and internationally.
Undervalued with excellent balance sheet.
Similar Companies
Market Insights

Advertisement
Community Narratives
The company that turned a verb into a global necessity and basically runs the modern internet, digital ads, smartphones, maps, and AI.
Fair Value US$300.00|7.1% undervalued
OS
Community Contributor
Flowers Foods Pays A Fair Price For Health
Fair Value US$16.12|26.4% undervalued
NV
Community Contributor
TMX Group will thrive with 33.3% profit margin and enduring market moat
Fair Value CA$49.90|0.8% overvalued
LI
Community Contributor
The "Molecular Pencil": Why Beam's Technology is Built to Win
Fair Value US$65.01|65.8% undervalued
DA
Community Contributor