Advertisement
- United States
- /
- Semiconductors
- /
- NasdaqGS:AMAT
Does Recent Analyst Optimism Signal a Good Entry Point for Applied Materials in 2025?

Simply Wall St
Reviewed by Bailey Pemberton
- Wondering if Applied Materials is a smart buy right now? You are not alone, as plenty of investors are searching for the stock's true value as it rides the ups and downs of today's market.
- Shares have delivered an impressive 36.7% return year-to-date and 29.4% over the past year. However, recent weeks have seen the stock ease back a bit, down 0.9% in the past week and 2.1% over the last month.
- Recent headlines have spotlighted industry tailwinds, with growing demand for semiconductor equipment fueling optimism. Applied Materials' key role in powering next-generation chip production has also been highlighted. There has been increased interest from analysts and market commentators as policy shifts and tech investments globally look to reshape the competitive landscape.
- Currently, Applied Materials holds a value score of 3 out of 6, meaning it is considered undervalued on half of our key checks. Soon we will break down classic approaches to valuing the business, and at the end, show you a better way to cut through the noise.
Find out why Applied Materials's 29.4% return over the last year is lagging behind its peers.
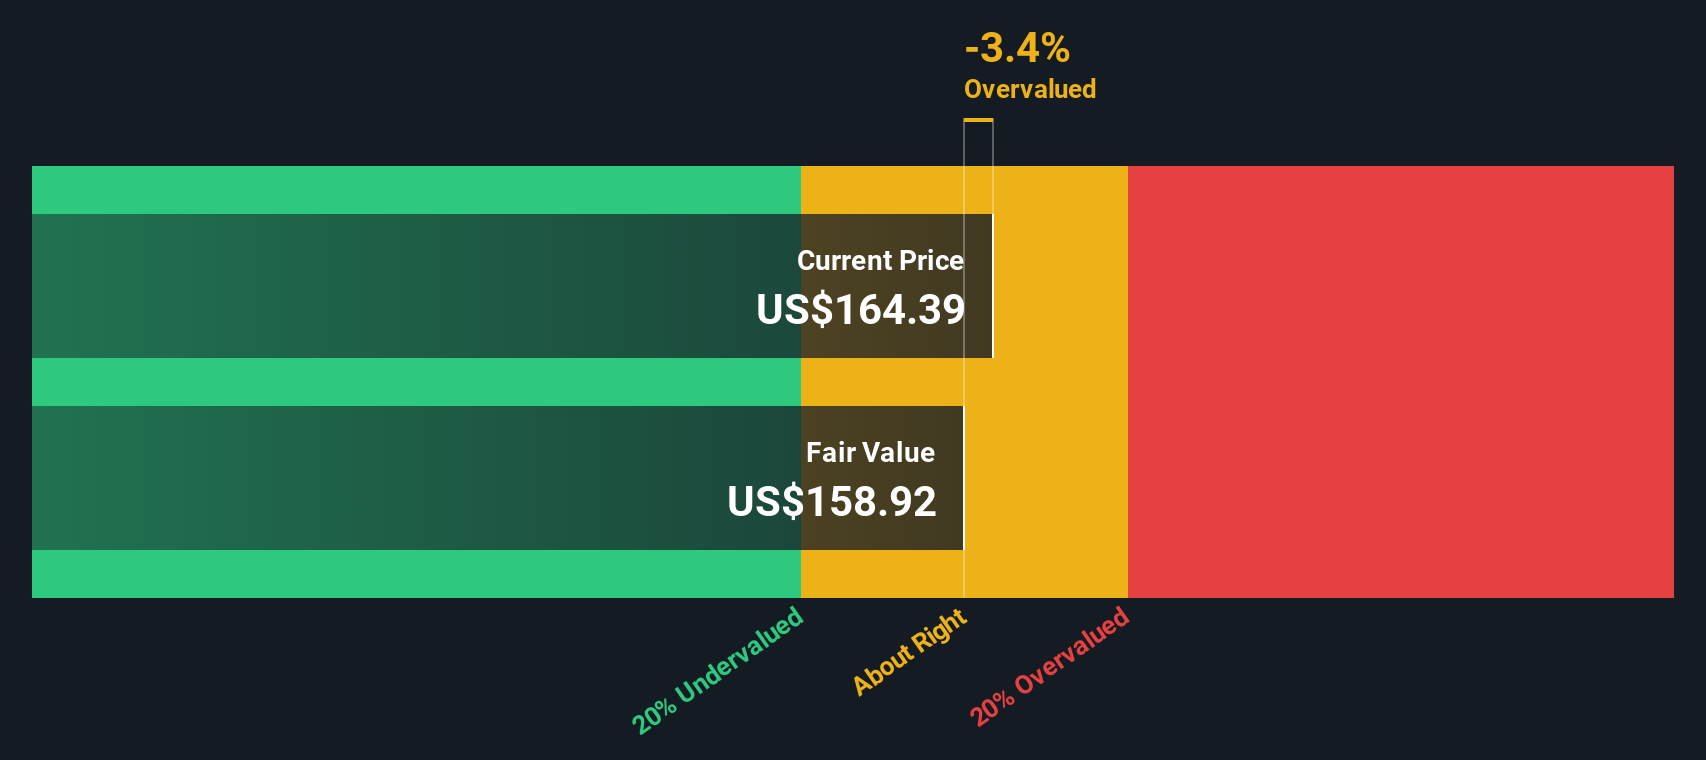
Approach 1: Applied Materials Discounted Cash Flow (DCF) Analysis
The Discounted Cash Flow (DCF) model estimates a company’s value by projecting its future cash flows and then discounting those amounts back to today’s value. This approach helps investors gauge what the company’s shares should be worth based on how much cash it is expected to generate.
For Applied Materials, the analysis starts with its latest twelve months’ Free Cash Flow, which stands at $6.38 billion. Analysts currently provide cash flow estimates for up to five years, and from there, the figures are extended further using extrapolated growth rates. By 2030, projections suggest Free Cash Flow could reach $10.27 billion. All figures are reported in US dollars.
After discounting these future cash flows, the model arrives at an intrinsic value of $155.43 per share. However, this DCF valuation indicates that Applied Materials is trading at a 44.1% premium to its calculated fair value. This suggests that the stock is significantly overvalued based on cash flow expectations.
Result: OVERVALUED
Our Discounted Cash Flow (DCF) analysis suggests Applied Materials may be overvalued by 44.1%. Discover 926 undervalued stocks or create your own screener to find better value opportunities.
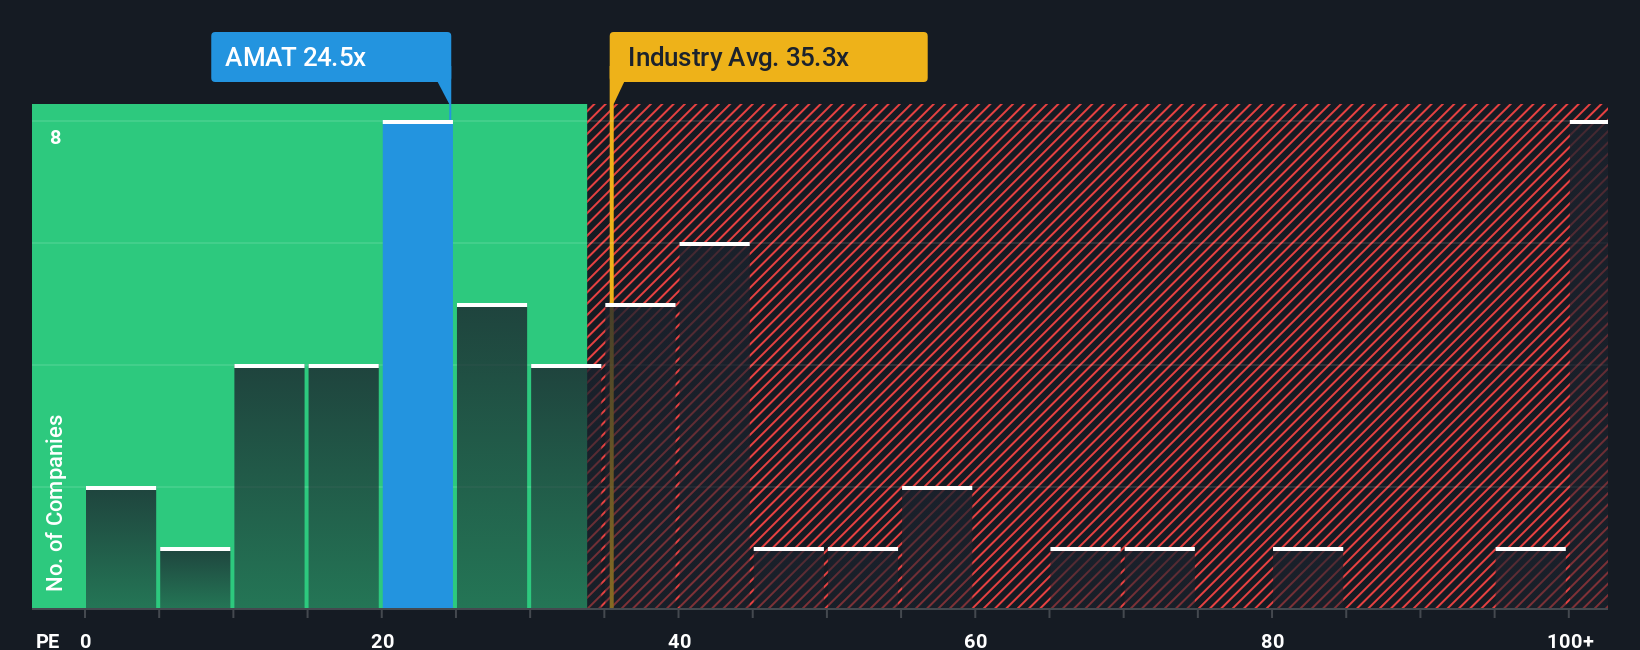
Approach 2: Applied Materials Price vs Earnings
For consistently profitable companies like Applied Materials, the Price-to-Earnings (PE) ratio is a widely used and effective valuation metric. It allows investors to see how much they are paying for each dollar of company earnings. A higher PE ratio typically signals greater growth expectations or lower perceived risk, while a lower PE often points to slower growth or higher risk.
Applied Materials trades at a PE ratio of 25x. This is below the Semiconductor industry average of 34x, and its peer group’s average, which stands at 36x. On the surface, this could suggest that the stock is attractively valued versus other chipmakers.
However, Simply Wall St’s proprietary "Fair Ratio" provides a more tailored benchmark. It incorporates not just industry trends and peer multiples, but also company-specific factors such as earnings growth outlook, profit margins, business risks, and market capitalization. For Applied Materials, the Fair Ratio is calculated to be 33x, reflecting what investors should reasonably be willing to pay if all these factors are taken into account. This makes it a superior comparison tool compared to relying solely on industry or peer multiples, which may not capture a company’s unique strengths or weaknesses.
Given Applied Materials’ current PE of 25x is meaningfully below the Fair Ratio of 33x, the stock appears to be undervalued based on this approach.
Result: UNDERVALUED
PE ratios tell one story, but what if the real opportunity lies elsewhere? Discover 1430 companies where insiders are betting big on explosive growth.
Upgrade Your Decision Making: Choose your Applied Materials Narrative
Earlier we mentioned that there is an even better way to understand valuation, so let's introduce you to Narratives. Narratives are a new, smarter way to make investment decisions, allowing you to build a story about a company that links the business outlook directly to a financial forecast and fair value. This approach grounds your perspective in both facts and context rather than just ratios or models.
With Narratives, you can easily create or choose a point of view for Applied Materials by adjusting your own expectations for revenue, profitability, or risk, and see what the stock should be worth if your story comes true. This tool is available and accessible to all investors, right on Simply Wall St’s Community page, already relied on by millions.
Narratives help you decide whether to buy or sell by showing if your view of fair value is higher or lower than the market price. Plus, Narratives update automatically as news or earnings come in, so your investment story always reflects the latest developments.
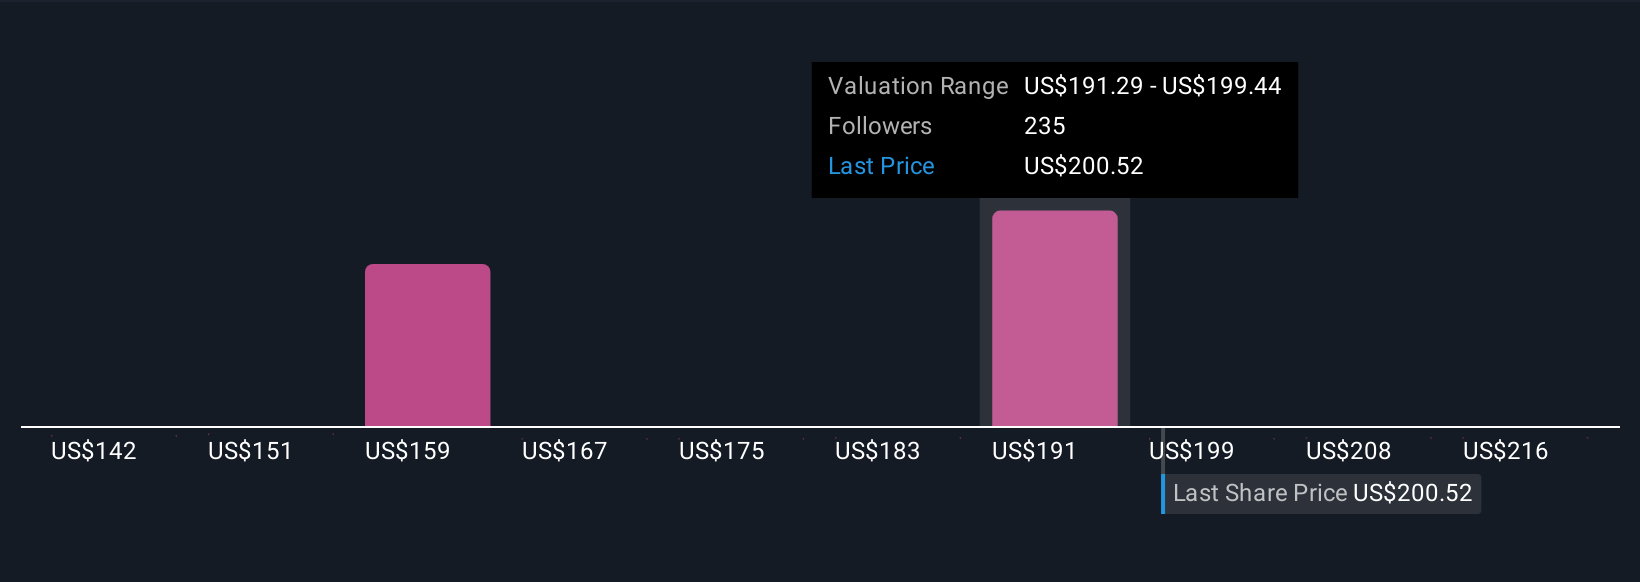
For example, some investors might see a fair value as high as $240 if they expect rapid AI-driven growth, while others believe it could be as low as $160 if they are concerned about industry cycles or trade risks. Narratives let you anchor your decisions to what you truly believe, making valuation personal, transparent, and dynamic.
Do you think there's more to the story for Applied Materials? Head over to our Community to see what others are saying!
This article by Simply Wall St is general in nature. We provide commentary based on historical data and analyst forecasts only using an unbiased methodology and our articles are not intended to be financial advice. It does not constitute a recommendation to buy or sell any stock, and does not take account of your objectives, or your financial situation. We aim to bring you long-term focused analysis driven by fundamental data. Note that our analysis may not factor in the latest price-sensitive company announcements or qualitative material. Simply Wall St has no position in any stocks mentioned.
New: Manage All Your Stock Portfolios in One Place
We've created the ultimate portfolio companion for stock investors, and it's free.
• Connect an unlimited number of Portfolios and see your total in one currency
• Be alerted to new Warning Signs or Risks via email or mobile
• Track the Fair Value of your stocks
Have feedback on this article? Concerned about the content? Get in touch with us directly. Alternatively, email editorial-team@simplywallst.com
About NasdaqGS:AMAT
Applied Materials
Engages in the provision of manufacturing equipment, services, and software to the semiconductor, display, and related industries.
Flawless balance sheet average dividend payer.
Similar Companies
Market Insights

Advertisement
Community Narratives
MicroVision will explode future revenue by 380.37% with a vision towards success
Fair Value US$60.00|98.4% undervalued
TH
Community Contributor
The Indispensable Artery for a New North American Economy
Fair Value CA$132.87|1.3% undervalued
TI
Community Contributor