- United States
- /
- Specialty Stores
- /
- NYSE:GPI
Group 1 Automotive's (NYSE:GPI) five-year earnings growth trails the 29% YoY shareholder returns


The most you can lose on any stock (assuming you don't use leverage) is 100% of your money. But on the bright side, if you buy shares in a high quality company at the right price, you can gain well over 100%. One great example is Group 1 Automotive, Inc. (NYSE:GPI) which saw its share price drive 249% higher over five years. It's also good to see the share price up 21% over the last quarter.
The past week has proven to be lucrative for Group 1 Automotive investors, so let's see if fundamentals drove the company's five-year performance.
See our latest analysis for Group 1 Automotive
There is no denying that markets are sometimes efficient, but prices do not always reflect underlying business performance. One imperfect but simple way to consider how the market perception of a company has shifted is to compare the change in the earnings per share (EPS) with the share price movement.
Over half a decade, Group 1 Automotive managed to grow its earnings per share at 39% a year. The EPS growth is more impressive than the yearly share price gain of 28% over the same period. So one could conclude that the broader market has become more cautious towards the stock. The reasonably low P/E ratio of 8.80 also suggests market apprehension.
The graphic below depicts how EPS has changed over time (unveil the exact values by clicking on the image).
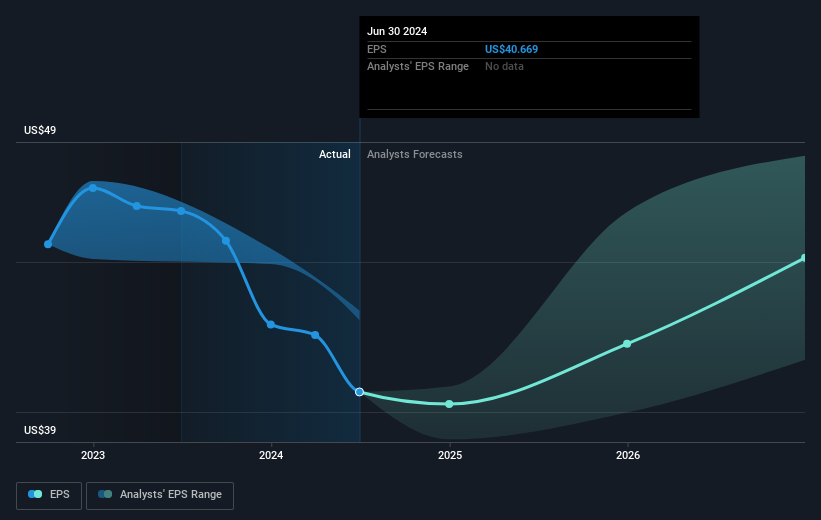
It might be well worthwhile taking a look at our free report on Group 1 Automotive's earnings, revenue and cash flow.
What About Dividends?
As well as measuring the share price return, investors should also consider the total shareholder return (TSR). The TSR incorporates the value of any spin-offs or discounted capital raisings, along with any dividends, based on the assumption that the dividends are reinvested. It's fair to say that the TSR gives a more complete picture for stocks that pay a dividend. In the case of Group 1 Automotive, it has a TSR of 262% for the last 5 years. That exceeds its share price return that we previously mentioned. And there's no prize for guessing that the dividend payments largely explain the divergence!
A Different Perspective
We're pleased to report that Group 1 Automotive shareholders have received a total shareholder return of 49% over one year. And that does include the dividend. That's better than the annualised return of 29% over half a decade, implying that the company is doing better recently. In the best case scenario, this may hint at some real business momentum, implying that now could be a great time to delve deeper. I find it very interesting to look at share price over the long term as a proxy for business performance. But to truly gain insight, we need to consider other information, too. To that end, you should learn about the 2 warning signs we've spotted with Group 1 Automotive (including 1 which makes us a bit uncomfortable) .
Of course Group 1 Automotive may not be the best stock to buy. So you may wish to see this free collection of growth stocks.
Please note, the market returns quoted in this article reflect the market weighted average returns of stocks that currently trade on American exchanges.
New: Manage All Your Stock Portfolios in One Place
We've created the ultimate portfolio companion for stock investors, and it's free.
• Connect an unlimited number of Portfolios and see your total in one currency
• Be alerted to new Warning Signs or Risks via email or mobile
• Track the Fair Value of your stocks
Have feedback on this article? Concerned about the content? Get in touch with us directly. Alternatively, email editorial-team (at) simplywallst.com.
This article by Simply Wall St is general in nature. We provide commentary based on historical data and analyst forecasts only using an unbiased methodology and our articles are not intended to be financial advice. It does not constitute a recommendation to buy or sell any stock, and does not take account of your objectives, or your financial situation. We aim to bring you long-term focused analysis driven by fundamental data. Note that our analysis may not factor in the latest price-sensitive company announcements or qualitative material. Simply Wall St has no position in any stocks mentioned.
About NYSE:GPI
Group 1 Automotive
Through its subsidiaries, operates in the automotive retail industry in the United States and the United Kingdom.
Undervalued with adequate balance sheet.
