- United States
- /
- Specialty Stores
- /
- NYSE:DKS
DICK'S Sporting Goods' (NYSE:DKS) earnings growth rate lags the 48% CAGR delivered to shareholders


Long term investing can be life changing when you buy and hold the truly great businesses. While the best companies are hard to find, but they can generate massive returns over long periods. To wit, the DICK'S Sporting Goods, Inc. (NYSE:DKS) share price has soared 494% over five years. This just goes to show the value creation that some businesses can achieve. On the other hand, the stock price has retraced 6.1% in the last week. But this could be related to the soft market, with stocks selling off around 4.2% in the last week.
While the stock has fallen 6.1% this week, it's worth focusing on the longer term and seeing if the stocks historical returns have been driven by the underlying fundamentals.
Check out our latest analysis for DICK'S Sporting Goods
While the efficient markets hypothesis continues to be taught by some, it has been proven that markets are over-reactive dynamic systems, and investors are not always rational. By comparing earnings per share (EPS) and share price changes over time, we can get a feel for how investor attitudes to a company have morphed over time.
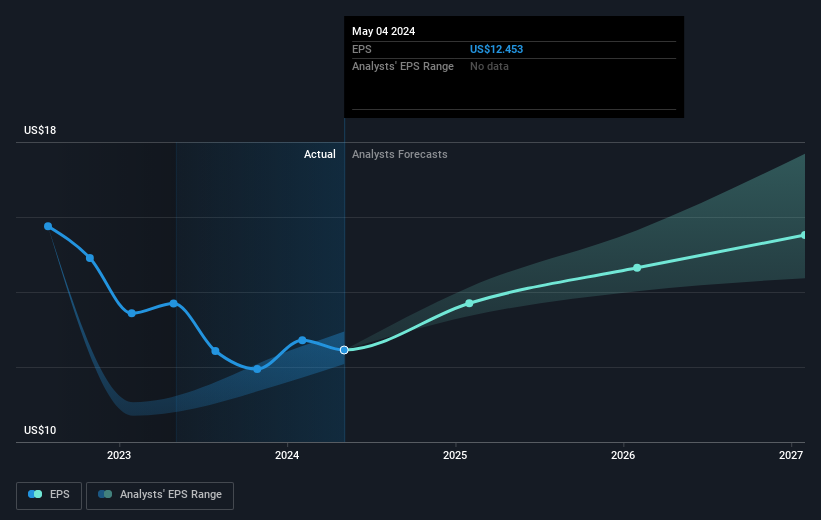
During five years of share price growth, DICK'S Sporting Goods achieved compound earnings per share (EPS) growth of 30% per year. This EPS growth is slower than the share price growth of 43% per year, over the same period. This suggests that market participants hold the company in higher regard, these days. And that's hardly shocking given the track record of growth.
You can see how EPS has changed over time in the image below (click on the chart to see the exact values).
We like that insiders have been buying shares in the last twelve months. Having said that, most people consider earnings and revenue growth trends to be a more meaningful guide to the business. Before buying or selling a stock, we always recommend a close examination of historic growth trends, available here..
What About Dividends?
When looking at investment returns, it is important to consider the difference between total shareholder return (TSR) and share price return. Whereas the share price return only reflects the change in the share price, the TSR includes the value of dividends (assuming they were reinvested) and the benefit of any discounted capital raising or spin-off. So for companies that pay a generous dividend, the TSR is often a lot higher than the share price return. As it happens, DICK'S Sporting Goods' TSR for the last 5 years was 602%, which exceeds the share price return mentioned earlier. The dividends paid by the company have thusly boosted the total shareholder return.
A Different Perspective
We're pleased to report that DICK'S Sporting Goods shareholders have received a total shareholder return of 39% over one year. That's including the dividend. However, the TSR over five years, coming in at 48% per year, is even more impressive. It's always interesting to track share price performance over the longer term. But to understand DICK'S Sporting Goods better, we need to consider many other factors. Case in point: We've spotted 1 warning sign for DICK'S Sporting Goods you should be aware of.
There are plenty of other companies that have insiders buying up shares. You probably do not want to miss this free list of undervalued small cap companies that insiders are buying.
Please note, the market returns quoted in this article reflect the market weighted average returns of stocks that currently trade on American exchanges.
New: Manage All Your Stock Portfolios in One Place
We've created the ultimate portfolio companion for stock investors, and it's free.
• Connect an unlimited number of Portfolios and see your total in one currency
• Be alerted to new Warning Signs or Risks via email or mobile
• Track the Fair Value of your stocks
Have feedback on this article? Concerned about the content? Get in touch with us directly. Alternatively, email editorial-team (at) simplywallst.com.
This article by Simply Wall St is general in nature. We provide commentary based on historical data and analyst forecasts only using an unbiased methodology and our articles are not intended to be financial advice. It does not constitute a recommendation to buy or sell any stock, and does not take account of your objectives, or your financial situation. We aim to bring you long-term focused analysis driven by fundamental data. Note that our analysis may not factor in the latest price-sensitive company announcements or qualitative material. Simply Wall St has no position in any stocks mentioned.
Have feedback on this article? Concerned about the content? Get in touch with us directly. Alternatively, email editorial-team@simplywallst.com
About NYSE:DKS
DICK'S Sporting Goods
Operates as an omni-channel sporting goods retailer primarily in the United States.
Undervalued with excellent balance sheet and pays a dividend.
