Advertisement
- United States
- /
- Specialty Stores
- /
- NasdaqGS:TDUP
ThredUp (TDUP): Revenue Forecast to Rise 10.8% Annually, Profitability Remains Out of Reach

Simply Wall St
Reviewed by Simply Wall St
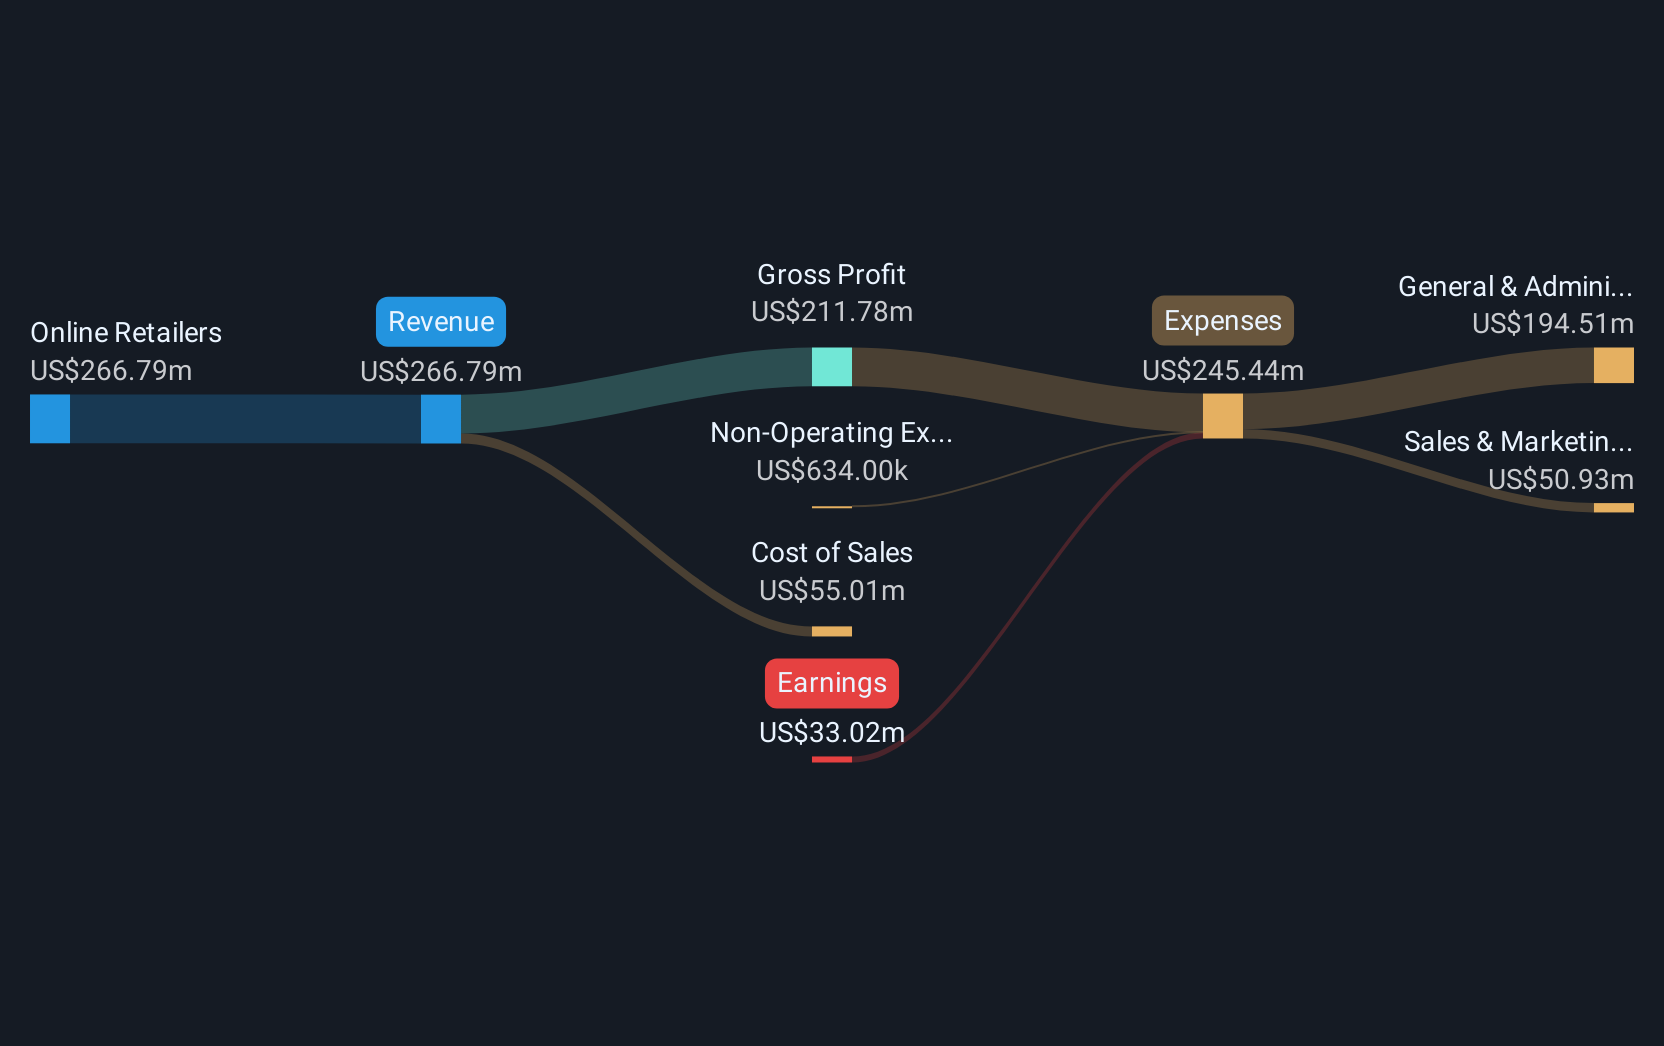
ThredUp (TDUP) remains unprofitable, but revenue is forecast to grow at 10.8% per year, while losses have narrowed by 14.8% annually over the past five years. With a Price-to-Sales Ratio of 3.4x, the stock trades well above the US Specialty Retail industry average of 0.4x and the peer average of 1.1x. While margins are still negative, ongoing top-line growth combined with improving losses gives investors reasons to keep an eye on the company’s progress.
See our full analysis for ThredUp.Now let’s see how these numbers stack up against the latest Simply Wall St community narratives. Some beliefs may be reinforced, while others might be challenged.
See what the community is saying about ThredUp
Technology Spend Lifts Gross Margin Potential
- ThredUp’s ongoing investment in AI-driven product experience and supply chain automation has resulted in stronger new buyer acquisition, improved conversion rates, and enhanced gross margins, which in turn improve both revenue and net margin as the technology scales.
- Analysts' consensus view highlights that technology upgrades, social commerce integrations, and supply chain automation are driving a compounding improvement in customer lifetime value and propelling both top-line revenue and net margins.
- The multi-year tech push is credited with record-high new buyer acquisition and improved buyer engagement, positioning ThredUp for sustained operational efficiency.
- Gross margin improvements lend support to the argument that scale and innovation can help close the profitability gap, despite ongoing negative bottom-line results.
B2B Growth Hopes Face Slow Uptake
- Resale-as-a-Service (RaaS) initiatives now involve over 60 brands in conversation, but analysts project that early momentum could be hampered by long ramp timelines or tepid brand adoption, potentially delaying revenue diversification.
- Analysts' consensus view notes that while B2B partnerships are a promising avenue, the speed and scale of adoption remain uncertain.
- Broad consensus is that new RaaS B2B streams could materially impact earnings if large apparel brands successfully onboard, but sluggish adoption may restrict top-line growth.
- This measured pace in B2B rollout limits how quickly ThredUp can offset operational costs or boost net margins through diversification.
Premium Valuation Despite Profitability Gap
- ThredUp trades at a Price-to-Sales Ratio of 3.4x, well above both the US Specialty Retail industry average (0.4x) and peer average (1.1x), even as the company remains unprofitable and its share price is $7.86, creating a valuation gap that could be hard to sustain if profit targets are not met.
- Analysts' consensus view is that, for ThredUp to justify its high price-to-sales multiple and reach the $12.50 analyst price target, earnings must rise to $18.0 million and margins must close the gap with industry peers.
- The contrast between rich valuation and ongoing losses challenges bulls to reconcile above-market pricing with the absence of positive earnings.
- The outlook for margin improvement is positive, but investors will need to see real traction before accepting the premium.
If you want the full story on whether ThredUp is worth its premium, check the deepest narrative dive at 📊 Read the full ThredUp Consensus Narrative.
Next Steps
To see how these results tie into long-term growth, risks, and valuation, check out the full range of community narratives for ThredUp on Simply Wall St. Add the company to your watchlist or portfolio so you'll be alerted when the story evolves.
Have your own take on the figures? In just a few minutes, you can put your perspective front and center and shape the discussion. Do it your way
A great starting point for your ThredUp research is our analysis highlighting 3 key rewards and 1 important warning sign that could impact your investment decision.
See What Else Is Out There
ThredUp’s premium price tag and persistent losses suggest growth is not translating quickly enough into sustainable profitability or competitive valuation.
If you want to compare businesses trading at more attractive levels, use these 841 undervalued stocks based on cash flows to target companies backed by strong cash flow at compelling prices right now.
This article by Simply Wall St is general in nature. We provide commentary based on historical data and analyst forecasts only using an unbiased methodology and our articles are not intended to be financial advice. It does not constitute a recommendation to buy or sell any stock, and does not take account of your objectives, or your financial situation. We aim to bring you long-term focused analysis driven by fundamental data. Note that our analysis may not factor in the latest price-sensitive company announcements or qualitative material. Simply Wall St has no position in any stocks mentioned.
Valuation is complex, but we're here to simplify it.
Discover if ThredUp might be undervalued or overvalued with our detailed analysis, featuring fair value estimates, potential risks, dividends, insider trades, and its financial condition.
Access Free AnalysisHave feedback on this article? Concerned about the content? Get in touch with us directly. Alternatively, email editorial-team@simplywallst.com
About NasdaqGS:TDUP
Excellent balance sheet with very low risk.
Similar Companies
Market Insights

Advertisement
Community Narratives
The company that turned a verb into a global necessity and basically runs the modern internet, digital ads, smartphones, maps, and AI.
Fair Value US$300.00|7.5% undervalued
OS
Community Contributor
Flowers Foods Pays A Fair Price For Health
Fair Value US$16.12|25.4% undervalued
NV
Community Contributor
TMX Group will thrive with 33.3% profit margin and enduring market moat
Fair Value CA$49.90|3.6% overvalued
LI
Community Contributor
The "Molecular Pencil": Why Beam's Technology is Built to Win
Fair Value US$65.01|65.0% undervalued
DA
Community Contributor