
Advertisement
- United States
- /
- Specialty Stores
- /
- NasdaqCM:EM
Is There An Opportunity With Smart Share Global Limited's (NASDAQ:EM) 36% Undervaluation?
Key Insights
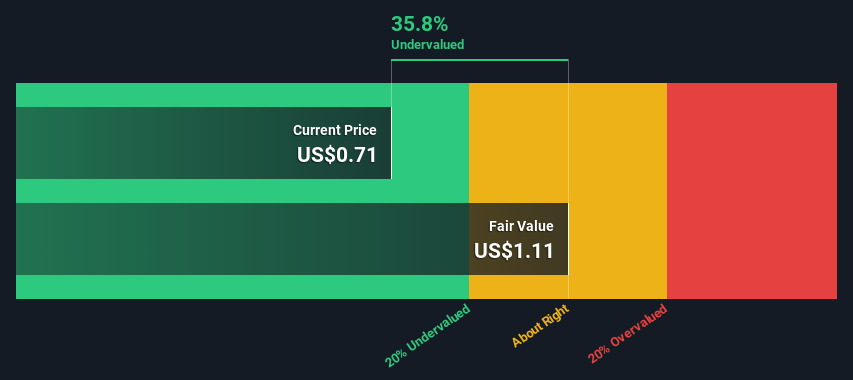
- The projected fair value for Smart Share Global is US$1.11 based on 2 Stage Free Cash Flow to Equity
- Smart Share Global's US$0.71 share price signals that it might be 36% undervalued
- Smart Share Global's peers are currently trading at a premium of 135% on average
Today we will run through one way of estimating the intrinsic value of Smart Share Global Limited (NASDAQ:EM) by taking the expected future cash flows and discounting them to today's value. We will use the Discounted Cash Flow (DCF) model on this occasion. Models like these may appear beyond the comprehension of a lay person, but they're fairly easy to follow.
Remember though, that there are many ways to estimate a company's value, and a DCF is just one method. If you want to learn more about discounted cash flow, the rationale behind this calculation can be read in detail in the Simply Wall St analysis model.
Check out our latest analysis for Smart Share Global
Is Smart Share Global Fairly Valued?
We're using the 2-stage growth model, which simply means we take in account two stages of company's growth. In the initial period the company may have a higher growth rate and the second stage is usually assumed to have a stable growth rate. In the first stage we need to estimate the cash flows to the business over the next ten years. Where possible we use analyst estimates, but when these aren't available we extrapolate the previous free cash flow (FCF) from the last estimate or reported value. We assume companies with shrinking free cash flow will slow their rate of shrinkage, and that companies with growing free cash flow will see their growth rate slow, over this period. We do this to reflect that growth tends to slow more in the early years than it does in later years.
Generally we assume that a dollar today is more valuable than a dollar in the future, so we need to discount the sum of these future cash flows to arrive at a present value estimate:
10-year free cash flow (FCF) estimate
| 2025 | 2026 | 2027 | 2028 | 2029 | 2030 | 2031 | 2032 | 2033 | 2034 | |
| Levered FCF (CN¥, Millions) | CN¥147.0m | CN¥109.0m | CN¥120.0m | CN¥126.0m | CN¥123.3m | CN¥122.4m | CN¥122.6m | CN¥123.7m | CN¥125.5m | CN¥127.6m |
| Growth Rate Estimate Source | Analyst x1 | Analyst x1 | Analyst x1 | Analyst x1 | Est @ -2.15% | Est @ -0.75% | Est @ 0.22% | Est @ 0.91% | Est @ 1.38% | Est @ 1.72% |
| Present Value (CN¥, Millions) Discounted @ 7.6% | CN¥137 | CN¥94.1 | CN¥96.3 | CN¥94.0 | CN¥85.4 | CN¥78.8 | CN¥73.4 | CN¥68.8 | CN¥64.8 | CN¥61.3 |
("Est" = FCF growth rate estimated by Simply Wall St)
Present Value of 10-year Cash Flow (PVCF) = CN¥854m
We now need to calculate the Terminal Value, which accounts for all the future cash flows after this ten year period. For a number of reasons a very conservative growth rate is used that cannot exceed that of a country's GDP growth. In this case we have used the 5-year average of the 10-year government bond yield (2.5%) to estimate future growth. In the same way as with the 10-year 'growth' period, we discount future cash flows to today's value, using a cost of equity of 7.6%.
Terminal Value (TV)= FCF2034 × (1 + g) ÷ (r – g) = CN¥128m× (1 + 2.5%) ÷ (7.6%– 2.5%) = CN¥2.6b
Present Value of Terminal Value (PVTV)= TV / (1 + r)10= CN¥2.6b÷ ( 1 + 7.6%)10= CN¥1.2b
The total value, or equity value, is then the sum of the present value of the future cash flows, which in this case is CN¥2.1b. The last step is to then divide the equity value by the number of shares outstanding. Compared to the current share price of US$0.7, the company appears quite undervalued at a 36% discount to where the stock price trades currently. Valuations are imprecise instruments though, rather like a telescope - move a few degrees and end up in a different galaxy. Do keep this in mind.
Important Assumptions
We would point out that the most important inputs to a discounted cash flow are the discount rate and of course the actual cash flows. You don't have to agree with these inputs, I recommend redoing the calculations yourself and playing with them. The DCF also does not consider the possible cyclicality of an industry, or a company's future capital requirements, so it does not give a full picture of a company's potential performance. Given that we are looking at Smart Share Global as potential shareholders, the cost of equity is used as the discount rate, rather than the cost of capital (or weighted average cost of capital, WACC) which accounts for debt. In this calculation we've used 7.6%, which is based on a levered beta of 1.026. Beta is a measure of a stock's volatility, compared to the market as a whole. We get our beta from the industry average beta of globally comparable companies, with an imposed limit between 0.8 and 2.0, which is a reasonable range for a stable business.
Moving On:
Valuation is only one side of the coin in terms of building your investment thesis, and it shouldn't be the only metric you look at when researching a company. The DCF model is not a perfect stock valuation tool. Rather it should be seen as a guide to "what assumptions need to be true for this stock to be under/overvalued?" If a company grows at a different rate, or if its cost of equity or risk free rate changes sharply, the output can look very different. What is the reason for the share price sitting below the intrinsic value? For Smart Share Global, there are three essential elements you should look at:
- Risks: For example, we've discovered 1 warning sign for Smart Share Global that you should be aware of before investing here.
- Future Earnings: How does EM's growth rate compare to its peers and the wider market? Dig deeper into the analyst consensus number for the upcoming years by interacting with our free analyst growth expectation chart.
- Other High Quality Alternatives: Do you like a good all-rounder? Explore our interactive list of high quality stocks to get an idea of what else is out there you may be missing!
PS. The Simply Wall St app conducts a discounted cash flow valuation for every stock on the NASDAQCM every day. If you want to find the calculation for other stocks just search here.
New: Manage All Your Stock Portfolios in One Place
We've created the ultimate portfolio companion for stock investors, and it's free.
• Connect an unlimited number of Portfolios and see your total in one currency
• Be alerted to new Warning Signs or Risks via email or mobile
• Track the Fair Value of your stocks
Have feedback on this article? Concerned about the content? Get in touch with us directly. Alternatively, email editorial-team (at) simplywallst.com.
This article by Simply Wall St is general in nature. We provide commentary based on historical data and analyst forecasts only using an unbiased methodology and our articles are not intended to be financial advice. It does not constitute a recommendation to buy or sell any stock, and does not take account of your objectives, or your financial situation. We aim to bring you long-term focused analysis driven by fundamental data. Note that our analysis may not factor in the latest price-sensitive company announcements or qualitative material. Simply Wall St has no position in any stocks mentioned.
Have feedback on this article? Concerned about the content? Get in touch with us directly. Alternatively, email editorial-team@simplywallst.com
About NasdaqCM:EM
Smart Share Global
A consumer tech company, provides mobile device charging services through online and offline network in the People's Republic of China.
Adequate balance sheet with weak fundamentals.
Market Insights

Advertisement
Community Narratives
The "Molecular Pencil": Why Beam's Technology is Built to Win
Fair Value US$65.01|65.8% undervalued
DA
Community Contributor
The silent giant behind virtually every advanced chip powering AI, smartphones, and modern infrastructure.
Fair Value US$310.00|7.6% undervalued
OS
Community Contributor
ADP Stock: Solid Fundamentals, But AI Investments Test Its Margin Resilience
Fair Value US$387.77|34.5% undervalued
YI
Community Contributor