- United States
- /
- Specialized REITs
- /
- NasdaqGS:EQIX
The total return for Equinix (NASDAQ:EQIX) investors has risen faster than earnings growth over the last five years


Equinix, Inc. (NASDAQ:EQIX) shareholders might be concerned after seeing the share price drop 12% in the last month. But at least the stock is up over the last five years. However we are not very impressed because the share price is only up 39%, less than the market return of 69%. While the long term returns are impressive, we do have some sympathy for those who bought more recently, given the 26% drop, in the last year.
While this past week has detracted from the company's five-year return, let's look at the recent trends of the underlying business and see if the gains have been in alignment.
Though if you're not interested in researching what drove EQIX's performance, we have a free list of interesting investing ideas to potentially inspire your next investment!
To quote Buffett, 'Ships will sail around the world but the Flat Earth Society will flourish. There will continue to be wide discrepancies between price and value in the marketplace...' By comparing earnings per share (EPS) and share price changes over time, we can get a feel for how investor attitudes to a company have morphed over time.
During five years of share price growth, Equinix achieved compound earnings per share (EPS) growth of 21% per year. This EPS growth is higher than the 7% average annual increase in the share price. So one could conclude that the broader market has become more cautious towards the stock. Of course, with a P/E ratio of 89.28, the market remains optimistic.
The graphic below depicts how EPS has changed over time (unveil the exact values by clicking on the image).
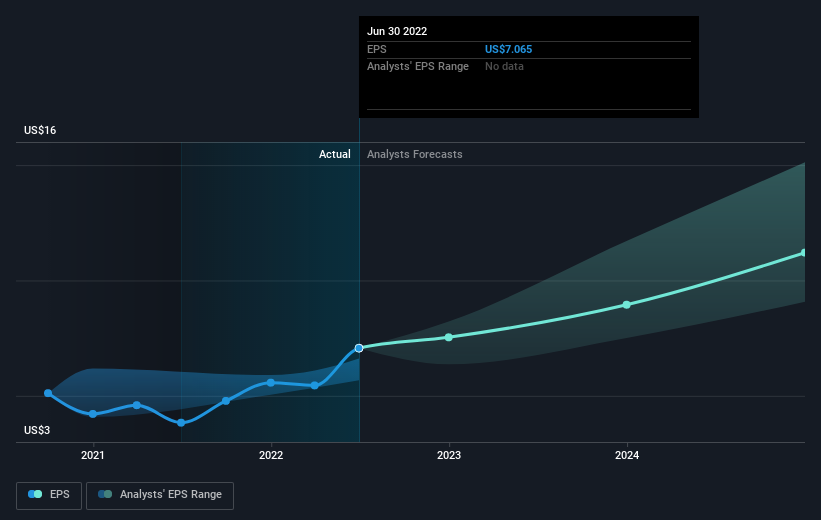
We know that Equinix has improved its bottom line lately, but is it going to grow revenue? If you're interested, you could check this free report showing consensus revenue forecasts.
What About Dividends?
It is important to consider the total shareholder return, as well as the share price return, for any given stock. Whereas the share price return only reflects the change in the share price, the TSR includes the value of dividends (assuming they were reinvested) and the benefit of any discounted capital raising or spin-off. So for companies that pay a generous dividend, the TSR is often a lot higher than the share price return. We note that for Equinix the TSR over the last 5 years was 53%, which is better than the share price return mentioned above. The dividends paid by the company have thusly boosted the total shareholder return.
A Different Perspective
We regret to report that Equinix shareholders are down 24% for the year (even including dividends). Unfortunately, that's worse than the broader market decline of 16%. Having said that, it's inevitable that some stocks will be oversold in a falling market. The key is to keep your eyes on the fundamental developments. On the bright side, long term shareholders have made money, with a gain of 9% per year over half a decade. It could be that the recent sell-off is an opportunity, so it may be worth checking the fundamental data for signs of a long term growth trend. While it is well worth considering the different impacts that market conditions can have on the share price, there are other factors that are even more important. Case in point: We've spotted 4 warning signs for Equinix you should be aware of, and 1 of them is potentially serious.
If you would prefer to check out another company -- one with potentially superior financials -- then do not miss this free list of companies that have proven they can grow earnings.
Please note, the market returns quoted in this article reflect the market weighted average returns of stocks that currently trade on US exchanges.
Valuation is complex, but we're here to simplify it.
Discover if Equinix might be undervalued or overvalued with our detailed analysis, featuring fair value estimates, potential risks, dividends, insider trades, and its financial condition.
Access Free AnalysisHave feedback on this article? Concerned about the content? Get in touch with us directly. Alternatively, email editorial-team (at) simplywallst.com.
This article by Simply Wall St is general in nature. We provide commentary based on historical data and analyst forecasts only using an unbiased methodology and our articles are not intended to be financial advice. It does not constitute a recommendation to buy or sell any stock, and does not take account of your objectives, or your financial situation. We aim to bring you long-term focused analysis driven by fundamental data. Note that our analysis may not factor in the latest price-sensitive company announcements or qualitative material. Simply Wall St has no position in any stocks mentioned.
About NasdaqGS:EQIX
Equinix
Equinix (Nasdaq: EQIX) is the world’s digital infrastructure company .
Established dividend payer with proven track record.

