
Advertisement
- United States
- /
- Real Estate
- /
- NasdaqGM:STHO
Health Check: How Prudently Does Star Holdings (NASDAQ:STHO) Use Debt?
Howard Marks put it nicely when he said that, rather than worrying about share price volatility, 'The possibility of permanent loss is the risk I worry about... and every practical investor I know worries about.' It's only natural to consider a company's balance sheet when you examine how risky it is, since debt is often involved when a business collapses. We note that Star Holdings (NASDAQ:STHO) does have debt on its balance sheet. But the real question is whether this debt is making the company risky.
When Is Debt Dangerous?
Debt assists a business until the business has trouble paying it off, either with new capital or with free cash flow. In the worst case scenario, a company can go bankrupt if it cannot pay its creditors. However, a more common (but still painful) scenario is that it has to raise new equity capital at a low price, thus permanently diluting shareholders. Having said that, the most common situation is where a company manages its debt reasonably well - and to its own advantage. When we examine debt levels, we first consider both cash and debt levels, together.
View our latest analysis for Star Holdings
What Is Star Holdings's Net Debt?
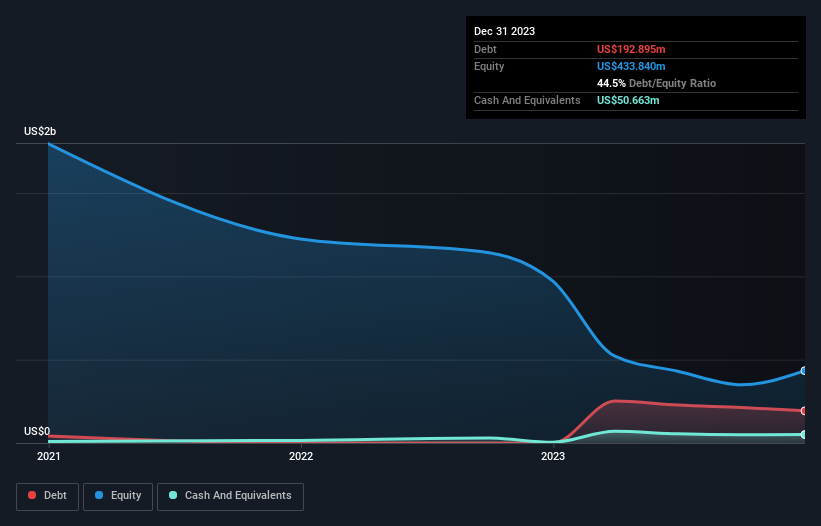
You can click the graphic below for the historical numbers, but it shows that as of December 2023 Star Holdings had US$192.9m of debt, an increase on none, over one year. However, it also had US$50.7m in cash, and so its net debt is US$142.2m.
A Look At Star Holdings' Liabilities
Zooming in on the latest balance sheet data, we can see that Star Holdings had liabilities of US$21.3m due within 12 months and liabilities of US$214.0m due beyond that. Offsetting this, it had US$50.7m in cash and US$20.1m in receivables that were due within 12 months. So its liabilities total US$164.6m more than the combination of its cash and short-term receivables.
This is a mountain of leverage relative to its market capitalization of US$173.0m. Should its lenders demand that it shore up the balance sheet, shareholders would likely face severe dilution. When analysing debt levels, the balance sheet is the obvious place to start. But it is Star Holdings's earnings that will influence how the balance sheet holds up in the future. So when considering debt, it's definitely worth looking at the earnings trend. Click here for an interactive snapshot.
In the last year Star Holdings's revenue was pretty flat, and it made a negative EBIT. While that's not too bad, we'd prefer see growth.
Caveat Emptor
Importantly, Star Holdings had an earnings before interest and tax (EBIT) loss over the last year. Indeed, it lost a very considerable US$31m at the EBIT level. When we look at that and recall the liabilities on its balance sheet, relative to cash, it seems unwise to us for the company to have any debt. So we think its balance sheet is a little strained, though not beyond repair. However, it doesn't help that it burned through US$19m of cash over the last year. So in short it's a really risky stock. There's no doubt that we learn most about debt from the balance sheet. However, not all investment risk resides within the balance sheet - far from it. We've identified 1 warning sign with Star Holdings , and understanding them should be part of your investment process.
If you're interested in investing in businesses that can grow profits without the burden of debt, then check out this free list of growing businesses that have net cash on the balance sheet.
New: Manage All Your Stock Portfolios in One Place
We've created the ultimate portfolio companion for stock investors, and it's free.
• Connect an unlimited number of Portfolios and see your total in one currency
• Be alerted to new Warning Signs or Risks via email or mobile
• Track the Fair Value of your stocks
Have feedback on this article? Concerned about the content? Get in touch with us directly. Alternatively, email editorial-team (at) simplywallst.com.
This article by Simply Wall St is general in nature. We provide commentary based on historical data and analyst forecasts only using an unbiased methodology and our articles are not intended to be financial advice. It does not constitute a recommendation to buy or sell any stock, and does not take account of your objectives, or your financial situation. We aim to bring you long-term focused analysis driven by fundamental data. Note that our analysis may not factor in the latest price-sensitive company announcements or qualitative material. Simply Wall St has no position in any stocks mentioned.
About NasdaqGM:STHO
Star Holdings
Engages in the non-ground lease real estate assets business in the United States.
Adequate balance sheet and slightly overvalued.
Market Insights

Advertisement
Community Narratives
MicroVision will explode future revenue by 380.37% with a vision towards success
Fair Value US$60.00|98.4% undervalued
TH
Community Contributor
The Indispensable Artery for a New North American Economy
Fair Value CA$132.87|1.3% undervalued
TI
Community Contributor