- United States
- /
- Real Estate
- /
- NasdaqGS:CSGP
Does This Valuation Of CoStar Group, Inc. (NASDAQ:CSGP) Imply Investors Are Overpaying?


Key Insights
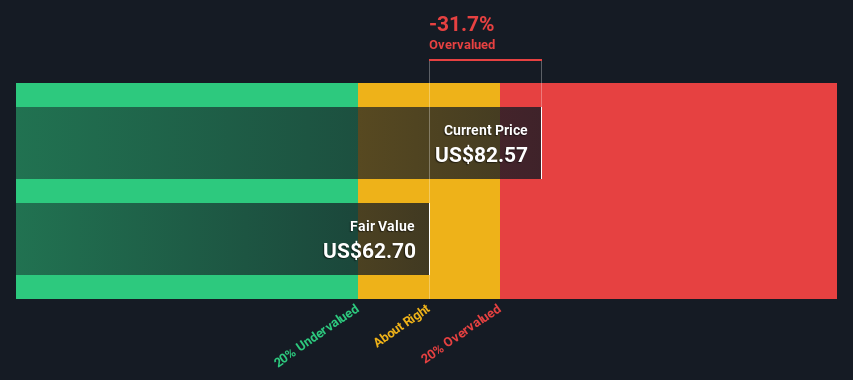
- CoStar Group's estimated fair value is US$62.70 based on 2 Stage Free Cash Flow to Equity
- CoStar Group is estimated to be 32% overvalued based on current share price of US$82.57
- Our fair value estimate is 35% lower than CoStar Group's analyst price target of US$95.93
Today we'll do a simple run through of a valuation method used to estimate the attractiveness of CoStar Group, Inc. (NASDAQ:CSGP) as an investment opportunity by taking the forecast future cash flows of the company and discounting them back to today's value. We will use the Discounted Cash Flow (DCF) model on this occasion. Don't get put off by the jargon, the math behind it is actually quite straightforward.
Companies can be valued in a lot of ways, so we would point out that a DCF is not perfect for every situation. If you want to learn more about discounted cash flow, the rationale behind this calculation can be read in detail in the Simply Wall St analysis model.
View our latest analysis for CoStar Group
What's The Estimated Valuation?
We use what is known as a 2-stage model, which simply means we have two different periods of growth rates for the company's cash flows. Generally the first stage is higher growth, and the second stage is a lower growth phase. To begin with, we have to get estimates of the next ten years of cash flows. Where possible we use analyst estimates, but when these aren't available we extrapolate the previous free cash flow (FCF) from the last estimate or reported value. We assume companies with shrinking free cash flow will slow their rate of shrinkage, and that companies with growing free cash flow will see their growth rate slow, over this period. We do this to reflect that growth tends to slow more in the early years than it does in later years.
Generally we assume that a dollar today is more valuable than a dollar in the future, so we discount the value of these future cash flows to their estimated value in today's dollars:
10-year free cash flow (FCF) estimate
| 2024 | 2025 | 2026 | 2027 | 2028 | 2029 | 2030 | 2031 | 2032 | 2033 | |
| Levered FCF ($, Millions) | US$547.8m | US$739.6m | US$927.6m | US$1.14b | US$1.30b | US$1.44b | US$1.55b | US$1.65b | US$1.73b | US$1.80b |
| Growth Rate Estimate Source | Analyst x9 | Analyst x7 | Analyst x1 | Analyst x1 | Est @ 13.95% | Est @ 10.41% | Est @ 7.93% | Est @ 6.20% | Est @ 4.98% | Est @ 4.13% |
| Present Value ($, Millions) Discounted @ 7.4% | US$510 | US$642 | US$750 | US$859 | US$912 | US$937 | US$942 | US$932 | US$911 | US$884 |
("Est" = FCF growth rate estimated by Simply Wall St)
Present Value of 10-year Cash Flow (PVCF) = US$8.3b
After calculating the present value of future cash flows in the initial 10-year period, we need to calculate the Terminal Value, which accounts for all future cash flows beyond the first stage. The Gordon Growth formula is used to calculate Terminal Value at a future annual growth rate equal to the 5-year average of the 10-year government bond yield of 2.2%. We discount the terminal cash flows to today's value at a cost of equity of 7.4%.
Terminal Value (TV)= FCF2033 × (1 + g) ÷ (r – g) = US$1.8b× (1 + 2.2%) ÷ (7.4%– 2.2%) = US$35b
Present Value of Terminal Value (PVTV)= TV / (1 + r)10= US$35b÷ ( 1 + 7.4%)10= US$17b
The total value, or equity value, is then the sum of the present value of the future cash flows, which in this case is US$26b. To get the intrinsic value per share, we divide this by the total number of shares outstanding. Compared to the current share price of US$82.6, the company appears potentially overvalued at the time of writing. The assumptions in any calculation have a big impact on the valuation, so it is better to view this as a rough estimate, not precise down to the last cent.
Important Assumptions
Now the most important inputs to a discounted cash flow are the discount rate, and of course, the actual cash flows. If you don't agree with these result, have a go at the calculation yourself and play with the assumptions. The DCF also does not consider the possible cyclicality of an industry, or a company's future capital requirements, so it does not give a full picture of a company's potential performance. Given that we are looking at CoStar Group as potential shareholders, the cost of equity is used as the discount rate, rather than the cost of capital (or weighted average cost of capital, WACC) which accounts for debt. In this calculation we've used 7.4%, which is based on a levered beta of 1.043. Beta is a measure of a stock's volatility, compared to the market as a whole. We get our beta from the industry average beta of globally comparable companies, with an imposed limit between 0.8 and 2.0, which is a reasonable range for a stable business.
SWOT Analysis for CoStar Group
- Earnings growth over the past year exceeded the industry.
- Debt is not viewed as a risk.
- Expensive based on P/E ratio and estimated fair value.
- Shareholders have been diluted in the past year.
- Annual earnings are forecast to grow faster than the American market.
- Revenue is forecast to grow slower than 20% per year.
Next Steps:
Although the valuation of a company is important, it ideally won't be the sole piece of analysis you scrutinize for a company. The DCF model is not a perfect stock valuation tool. Instead the best use for a DCF model is to test certain assumptions and theories to see if they would lead to the company being undervalued or overvalued. For instance, if the terminal value growth rate is adjusted slightly, it can dramatically alter the overall result. Can we work out why the company is trading at a premium to intrinsic value? For CoStar Group, we've put together three important items you should further research:
- Risks: Every company has them, and we've spotted 2 warning signs for CoStar Group you should know about.
- Future Earnings: How does CSGP's growth rate compare to its peers and the wider market? Dig deeper into the analyst consensus number for the upcoming years by interacting with our free analyst growth expectation chart.
- Other High Quality Alternatives: Do you like a good all-rounder? Explore our interactive list of high quality stocks to get an idea of what else is out there you may be missing!
PS. The Simply Wall St app conducts a discounted cash flow valuation for every stock on the NASDAQGS every day. If you want to find the calculation for other stocks just search here.
New: AI Stock Screener & Alerts
Our new AI Stock Screener scans the market every day to uncover opportunities.
• Dividend Powerhouses (3%+ Yield)
• Undervalued Small Caps with Insider Buying
• High growth Tech and AI Companies
Or build your own from over 50 metrics.
Have feedback on this article? Concerned about the content? Get in touch with us directly. Alternatively, email editorial-team (at) simplywallst.com.
This article by Simply Wall St is general in nature. We provide commentary based on historical data and analyst forecasts only using an unbiased methodology and our articles are not intended to be financial advice. It does not constitute a recommendation to buy or sell any stock, and does not take account of your objectives, or your financial situation. We aim to bring you long-term focused analysis driven by fundamental data. Note that our analysis may not factor in the latest price-sensitive company announcements or qualitative material. Simply Wall St has no position in any stocks mentioned.
About NasdaqGS:CSGP
CoStar Group
Provides information, analytics, and online marketplace services to the commercial real estate, hospitality, residential, and related professionals industries in the United States, Canada, Europe, the Asia Pacific, and Latin America.
Excellent balance sheet with reasonable growth potential.

