Stock Analysis
- United States
- /
- Pharma
- /
- NYSE:MRK
Is Merck & Co., Inc. (NYSE:MRK) Trading At A 47% Discount?

Key Insights
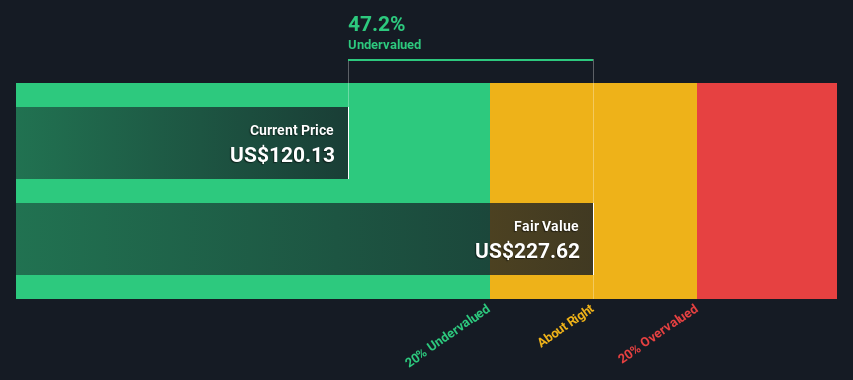
- The projected fair value for Merck is US$228 based on 2 Stage Free Cash Flow to Equity
- Merck is estimated to be 47% undervalued based on current share price of US$120
- Analyst price target for MRK is US$125 which is 45% below our fair value estimate
Today we will run through one way of estimating the intrinsic value of Merck & Co., Inc. (NYSE:MRK) by projecting its future cash flows and then discounting them to today's value. We will use the Discounted Cash Flow (DCF) model on this occasion. Before you think you won't be able to understand it, just read on! It's actually much less complex than you'd imagine.
Companies can be valued in a lot of ways, so we would point out that a DCF is not perfect for every situation. If you want to learn more about discounted cash flow, the rationale behind this calculation can be read in detail in the Simply Wall St analysis model.
View our latest analysis for Merck
Crunching The Numbers
We are going to use a two-stage DCF model, which, as the name states, takes into account two stages of growth. The first stage is generally a higher growth period which levels off heading towards the terminal value, captured in the second 'steady growth' period. To start off with, we need to estimate the next ten years of cash flows. Where possible we use analyst estimates, but when these aren't available we extrapolate the previous free cash flow (FCF) from the last estimate or reported value. We assume companies with shrinking free cash flow will slow their rate of shrinkage, and that companies with growing free cash flow will see their growth rate slow, over this period. We do this to reflect that growth tends to slow more in the early years than it does in later years.
Generally we assume that a dollar today is more valuable than a dollar in the future, and so the sum of these future cash flows is then discounted to today's value:
10-year free cash flow (FCF) estimate
| 2024 | 2025 | 2026 | 2027 | 2028 | 2029 | 2030 | 2031 | 2032 | 2033 | |
| Levered FCF ($, Millions) | US$19.1b | US$22.2b | US$23.8b | US$25.3b | US$25.7b | US$26.2b | US$26.7b | US$27.2b | US$27.8b | US$28.4b |
| Growth Rate Estimate Source | Analyst x6 | Analyst x7 | Analyst x3 | Analyst x3 | Analyst x3 | Est @ 1.77% | Est @ 1.90% | Est @ 2.00% | Est @ 2.07% | Est @ 2.11% |
| Present Value ($, Millions) Discounted @ 6.2% | US$18.0k | US$19.6k | US$19.9k | US$19.9k | US$19.0k | US$18.2k | US$17.5k | US$16.8k | US$16.1k | US$15.5k |
("Est" = FCF growth rate estimated by Simply Wall St)
Present Value of 10-year Cash Flow (PVCF) = US$181b
We now need to calculate the Terminal Value, which accounts for all the future cash flows after this ten year period. For a number of reasons a very conservative growth rate is used that cannot exceed that of a country's GDP growth. In this case we have used the 5-year average of the 10-year government bond yield (2.2%) to estimate future growth. In the same way as with the 10-year 'growth' period, we discount future cash flows to today's value, using a cost of equity of 6.2%.
Terminal Value (TV)= FCF2033 × (1 + g) ÷ (r – g) = US$28b× (1 + 2.2%) ÷ (6.2%– 2.2%) = US$725b
Present Value of Terminal Value (PVTV)= TV / (1 + r)10= US$725b÷ ( 1 + 6.2%)10= US$396b
The total value, or equity value, is then the sum of the present value of the future cash flows, which in this case is US$577b. The last step is to then divide the equity value by the number of shares outstanding. Relative to the current share price of US$120, the company appears quite undervalued at a 47% discount to where the stock price trades currently. Valuations are imprecise instruments though, rather like a telescope - move a few degrees and end up in a different galaxy. Do keep this in mind.
The Assumptions
We would point out that the most important inputs to a discounted cash flow are the discount rate and of course the actual cash flows. Part of investing is coming up with your own evaluation of a company's future performance, so try the calculation yourself and check your own assumptions. The DCF also does not consider the possible cyclicality of an industry, or a company's future capital requirements, so it does not give a full picture of a company's potential performance. Given that we are looking at Merck as potential shareholders, the cost of equity is used as the discount rate, rather than the cost of capital (or weighted average cost of capital, WACC) which accounts for debt. In this calculation we've used 6.2%, which is based on a levered beta of 0.800. Beta is a measure of a stock's volatility, compared to the market as a whole. We get our beta from the industry average beta of globally comparable companies, with an imposed limit between 0.8 and 2.0, which is a reasonable range for a stable business.
SWOT Analysis for Merck
- Debt is well covered by earnings and cashflows.
- Earnings declined over the past year.
- Dividend is low compared to the top 25% of dividend payers in the Pharmaceuticals market.
- Annual earnings are forecast to grow faster than the American market.
- Trading below our estimate of fair value by more than 20%.
- Dividends are not covered by earnings.
- Annual revenue is forecast to grow slower than the American market.
Next Steps:
Valuation is only one side of the coin in terms of building your investment thesis, and it is only one of many factors that you need to assess for a company. The DCF model is not a perfect stock valuation tool. Instead the best use for a DCF model is to test certain assumptions and theories to see if they would lead to the company being undervalued or overvalued. For instance, if the terminal value growth rate is adjusted slightly, it can dramatically alter the overall result. Can we work out why the company is trading at a discount to intrinsic value? For Merck, we've put together three additional aspects you should look at:
- Risks: Case in point, we've spotted 5 warning signs for Merck you should be aware of.
- Management:Have insiders been ramping up their shares to take advantage of the market's sentiment for MRK's future outlook? Check out our management and board analysis with insights on CEO compensation and governance factors.
- Other Solid Businesses: Low debt, high returns on equity and good past performance are fundamental to a strong business. Why not explore our interactive list of stocks with solid business fundamentals to see if there are other companies you may not have considered!
PS. The Simply Wall St app conducts a discounted cash flow valuation for every stock on the NYSE every day. If you want to find the calculation for other stocks just search here.
Valuation is complex, but we're helping make it simple.
Find out whether Merck is potentially over or undervalued by checking out our comprehensive analysis, which includes fair value estimates, risks and warnings, dividends, insider transactions and financial health.
View the Free AnalysisHave feedback on this article? Concerned about the content? Get in touch with us directly. Alternatively, email editorial-team (at) simplywallst.com.
This article by Simply Wall St is general in nature. We provide commentary based on historical data and analyst forecasts only using an unbiased methodology and our articles are not intended to be financial advice. It does not constitute a recommendation to buy or sell any stock, and does not take account of your objectives, or your financial situation. We aim to bring you long-term focused analysis driven by fundamental data. Note that our analysis may not factor in the latest price-sensitive company announcements or qualitative material. Simply Wall St has no position in any stocks mentioned.
About NYSE:MRK
Reasonable growth potential average dividend payer.

