- United States
- /
- Pharma
- /
- NYSE:JNJ
Johnson & Johnson (NYSE:JNJ) Stock's Been Sliding But Fundamentals Look Decent: Will The Market Correct The Share Price In The Future?


Johnson & Johnson (NYSE:JNJ) has had a rough three months with its share price down 7.8%. But if you pay close attention, you might find that its key financial indicators look quite decent, which could mean that the stock could potentially rise in the long-term given how markets usually reward more resilient long-term fundamentals. In this article, we decided to focus on Johnson & Johnson's ROE.
ROE or return on equity is a useful tool to assess how effectively a company can generate returns on the investment it received from its shareholders. Put another way, it reveals the company's success at turning shareholder investments into profits.
Check out our latest analysis for Johnson & Johnson
How To Calculate Return On Equity?
ROE can be calculated by using the formula:
Return on Equity = Net Profit (from continuing operations) ÷ Shareholders' Equity
So, based on the above formula, the ROE for Johnson & Johnson is:
24% = US$17b ÷ US$70b (Based on the trailing twelve months to March 2024).
The 'return' is the profit over the last twelve months. So, this means that for every $1 of its shareholder's investments, the company generates a profit of $0.24.
What Has ROE Got To Do With Earnings Growth?
So far, we've learned that ROE is a measure of a company's profitability. Based on how much of its profits the company chooses to reinvest or "retain", we are then able to evaluate a company's future ability to generate profits. Assuming everything else remains unchanged, the higher the ROE and profit retention, the higher the growth rate of a company compared to companies that don't necessarily bear these characteristics.
A Side By Side comparison of Johnson & Johnson's Earnings Growth And 24% ROE
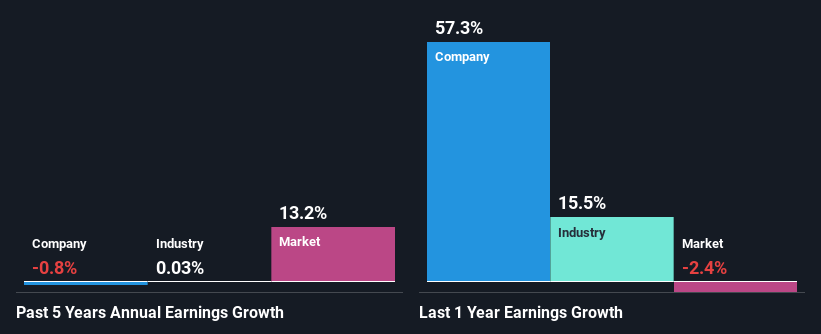
To begin with, Johnson & Johnson has a pretty high ROE which is interesting. Second, a comparison with the average ROE reported by the industry of 15% also doesn't go unnoticed by us. However, we are curious as to how the high returns still resulted in a flat growth for Johnson & Johnson in the past five years. We reckon that there could be some other factors at play here that's limiting the company's growth. These include low earnings retention or poor allocation of capital
We then compared Johnson & Johnson's net income growth with the industry and found that the company's growth figure is a bit less than the average industry growth rate of 0.03% in the same 5-year period.
Earnings growth is an important metric to consider when valuing a stock. It’s important for an investor to know whether the market has priced in the company's expected earnings growth (or decline). By doing so, they will have an idea if the stock is headed into clear blue waters or if swampy waters await. Is JNJ fairly valued? This infographic on the company's intrinsic value has everything you need to know.
Is Johnson & Johnson Efficiently Re-investing Its Profits?
Johnson & Johnson has a high three-year median payout ratio of 69% (or a retention ratio of 31%), meaning that the company is paying most of its profits as dividends to its shareholders. This does go some way in explaining why there's been no growth in its earnings.
Additionally, Johnson & Johnson has paid dividends over a period of at least ten years, which means that the company's management is determined to pay dividends even if it means little to no earnings growth. Existing analyst estimates suggest that the company's future payout ratio is expected to drop to 46% over the next three years. Accordingly, the expected drop in the payout ratio explains the expected increase in the company's ROE to 39%, over the same period.
Summary
On the whole, we do feel that Johnson & Johnson has some positive attributes. Although, we are disappointed to see a lack of growth in earnings even in spite of a high ROE. Bear in mind, the company reinvests a small portion of its profits, which means that investors aren't reaping the benefits of the high rate of return. Up till now, we've only made a short study of the company's growth data. To gain further insights into Johnson & Johnson's past profit growth, check out this visualization of past earnings, revenue and cash flows.
New: Manage All Your Stock Portfolios in One Place
We've created the ultimate portfolio companion for stock investors, and it's free.
• Connect an unlimited number of Portfolios and see your total in one currency
• Be alerted to new Warning Signs or Risks via email or mobile
• Track the Fair Value of your stocks
Have feedback on this article? Concerned about the content? Get in touch with us directly. Alternatively, email editorial-team (at) simplywallst.com.
This article by Simply Wall St is general in nature. We provide commentary based on historical data and analyst forecasts only using an unbiased methodology and our articles are not intended to be financial advice. It does not constitute a recommendation to buy or sell any stock, and does not take account of your objectives, or your financial situation. We aim to bring you long-term focused analysis driven by fundamental data. Note that our analysis may not factor in the latest price-sensitive company announcements or qualitative material. Simply Wall St has no position in any stocks mentioned.
Have feedback on this article? Concerned about the content? Get in touch with us directly. Alternatively, email editorial-team@simplywallst.com
About NYSE:JNJ
Johnson & Johnson
Researches, develops, manufactures, and sells various products in the healthcare field worldwide.
Excellent balance sheet established dividend payer.

