

Key Insights
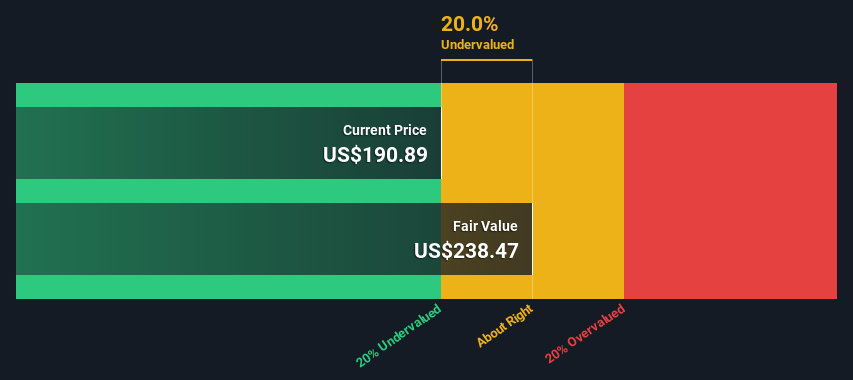
- IQVIA Holdings' estimated fair value is US$238 based on 2 Stage Free Cash Flow to Equity
- With US$191 share price, IQVIA Holdings appears to be trading close to its estimated fair value
- The US$260 analyst price target for IQV is 8.9% more than our estimate of fair value
Does the March share price for IQVIA Holdings Inc. (NYSE:IQV) reflect what it's really worth? Today, we will estimate the stock's intrinsic value by taking the expected future cash flows and discounting them to their present value. We will use the Discounted Cash Flow (DCF) model on this occasion. Believe it or not, it's not too difficult to follow, as you'll see from our example!
Companies can be valued in a lot of ways, so we would point out that a DCF is not perfect for every situation. If you still have some burning questions about this type of valuation, take a look at the Simply Wall St analysis model.
View our latest analysis for IQVIA Holdings
Step By Step Through The Calculation
We're using the 2-stage growth model, which simply means we take in account two stages of company's growth. In the initial period the company may have a higher growth rate and the second stage is usually assumed to have a stable growth rate. To start off with, we need to estimate the next ten years of cash flows. Where possible we use analyst estimates, but when these aren't available we extrapolate the previous free cash flow (FCF) from the last estimate or reported value. We assume companies with shrinking free cash flow will slow their rate of shrinkage, and that companies with growing free cash flow will see their growth rate slow, over this period. We do this to reflect that growth tends to slow more in the early years than it does in later years.
A DCF is all about the idea that a dollar in the future is less valuable than a dollar today, so we need to discount the sum of these future cash flows to arrive at a present value estimate:
10-year free cash flow (FCF) forecast
| 2023 | 2024 | 2025 | 2026 | 2027 | 2028 | 2029 | 2030 | 2031 | 2032 | |
| Levered FCF ($, Millions) | US$1.92b | US$2.15b | US$2.36b | US$2.55b | US$2.87b | US$3.08b | US$3.25b | US$3.40b | US$3.53b | US$3.65b |
| Growth Rate Estimate Source | Analyst x6 | Analyst x7 | Analyst x5 | Analyst x2 | Analyst x1 | Est @ 7.25% | Est @ 5.69% | Est @ 4.61% | Est @ 3.85% | Est @ 3.31% |
| Present Value ($, Millions) Discounted @ 8.4% | US$1.8k | US$1.8k | US$1.8k | US$1.8k | US$1.9k | US$1.9k | US$1.8k | US$1.8k | US$1.7k | US$1.6k |
("Est" = FCF growth rate estimated by Simply Wall St)
Present Value of 10-year Cash Flow (PVCF) = US$18b
The second stage is also known as Terminal Value, this is the business's cash flow after the first stage. For a number of reasons a very conservative growth rate is used that cannot exceed that of a country's GDP growth. In this case we have used the 5-year average of the 10-year government bond yield (2.1%) to estimate future growth. In the same way as with the 10-year 'growth' period, we discount future cash flows to today's value, using a cost of equity of 8.4%.
Terminal Value (TV)= FCF2032 × (1 + g) ÷ (r – g) = US$3.6b× (1 + 2.1%) ÷ (8.4%– 2.1%) = US$59b
Present Value of Terminal Value (PVTV)= TV / (1 + r)10= US$59b÷ ( 1 + 8.4%)10= US$26b
The total value is the sum of cash flows for the next ten years plus the discounted terminal value, which results in the Total Equity Value, which in this case is US$44b. The last step is to then divide the equity value by the number of shares outstanding. Compared to the current share price of US$191, the company appears about fair value at a 20% discount to where the stock price trades currently. Remember though, that this is just an approximate valuation, and like any complex formula - garbage in, garbage out.
Important Assumptions
We would point out that the most important inputs to a discounted cash flow are the discount rate and of course the actual cash flows. Part of investing is coming up with your own evaluation of a company's future performance, so try the calculation yourself and check your own assumptions. The DCF also does not consider the possible cyclicality of an industry, or a company's future capital requirements, so it does not give a full picture of a company's potential performance. Given that we are looking at IQVIA Holdings as potential shareholders, the cost of equity is used as the discount rate, rather than the cost of capital (or weighted average cost of capital, WACC) which accounts for debt. In this calculation we've used 8.4%, which is based on a levered beta of 1.067. Beta is a measure of a stock's volatility, compared to the market as a whole. We get our beta from the industry average beta of globally comparable companies, with an imposed limit between 0.8 and 2.0, which is a reasonable range for a stable business.
SWOT Analysis for IQVIA Holdings
- Earnings growth over the past year exceeded the industry.
- Debt is well covered by earnings.
- No major weaknesses identified for IQV.
- Annual revenue is forecast to grow faster than the American market.
- Current share price is below our estimate of fair value.
- Debt is not well covered by operating cash flow.
- Annual earnings are forecast to grow slower than the American market.
Moving On:
Although the valuation of a company is important, it is only one of many factors that you need to assess for a company. It's not possible to obtain a foolproof valuation with a DCF model. Rather it should be seen as a guide to "what assumptions need to be true for this stock to be under/overvalued?" If a company grows at a different rate, or if its cost of equity or risk free rate changes sharply, the output can look very different. For IQVIA Holdings, we've put together three further elements you should look at:
- Risks: For example, we've discovered 2 warning signs for IQVIA Holdings (1 is significant!) that you should be aware of before investing here.
- Management:Have insiders been ramping up their shares to take advantage of the market's sentiment for IQV's future outlook? Check out our management and board analysis with insights on CEO compensation and governance factors.
- Other High Quality Alternatives: Do you like a good all-rounder? Explore our interactive list of high quality stocks to get an idea of what else is out there you may be missing!
PS. Simply Wall St updates its DCF calculation for every American stock every day, so if you want to find the intrinsic value of any other stock just search here.
New: AI Stock Screener & Alerts
Our new AI Stock Screener scans the market every day to uncover opportunities.
• Dividend Powerhouses (3%+ Yield)
• Undervalued Small Caps with Insider Buying
• High growth Tech and AI Companies
Or build your own from over 50 metrics.
Have feedback on this article? Concerned about the content? Get in touch with us directly. Alternatively, email editorial-team (at) simplywallst.com.
This article by Simply Wall St is general in nature. We provide commentary based on historical data and analyst forecasts only using an unbiased methodology and our articles are not intended to be financial advice. It does not constitute a recommendation to buy or sell any stock, and does not take account of your objectives, or your financial situation. We aim to bring you long-term focused analysis driven by fundamental data. Note that our analysis may not factor in the latest price-sensitive company announcements or qualitative material. Simply Wall St has no position in any stocks mentioned.
About NYSE:IQV
IQVIA Holdings
Engages in the provision of advanced analytics, technology solutions, and clinical research services to the life sciences industry in the Americas, Europe, Africa, and the Asia-Pacific.
Very undervalued with proven track record.

