
Advertisement
- United States
- /
- Biotech
- /
- NasdaqCM:VRDN
Viridian Therapeutics, Inc.'s (NASDAQ:VRDN) 39% Price Boost Is Out Of Tune With Revenues
Despite an already strong run, Viridian Therapeutics, Inc. (NASDAQ:VRDN) shares have been powering on, with a gain of 39% in the last thirty days. Looking back a bit further, it's encouraging to see the stock is up 50% in the last year.
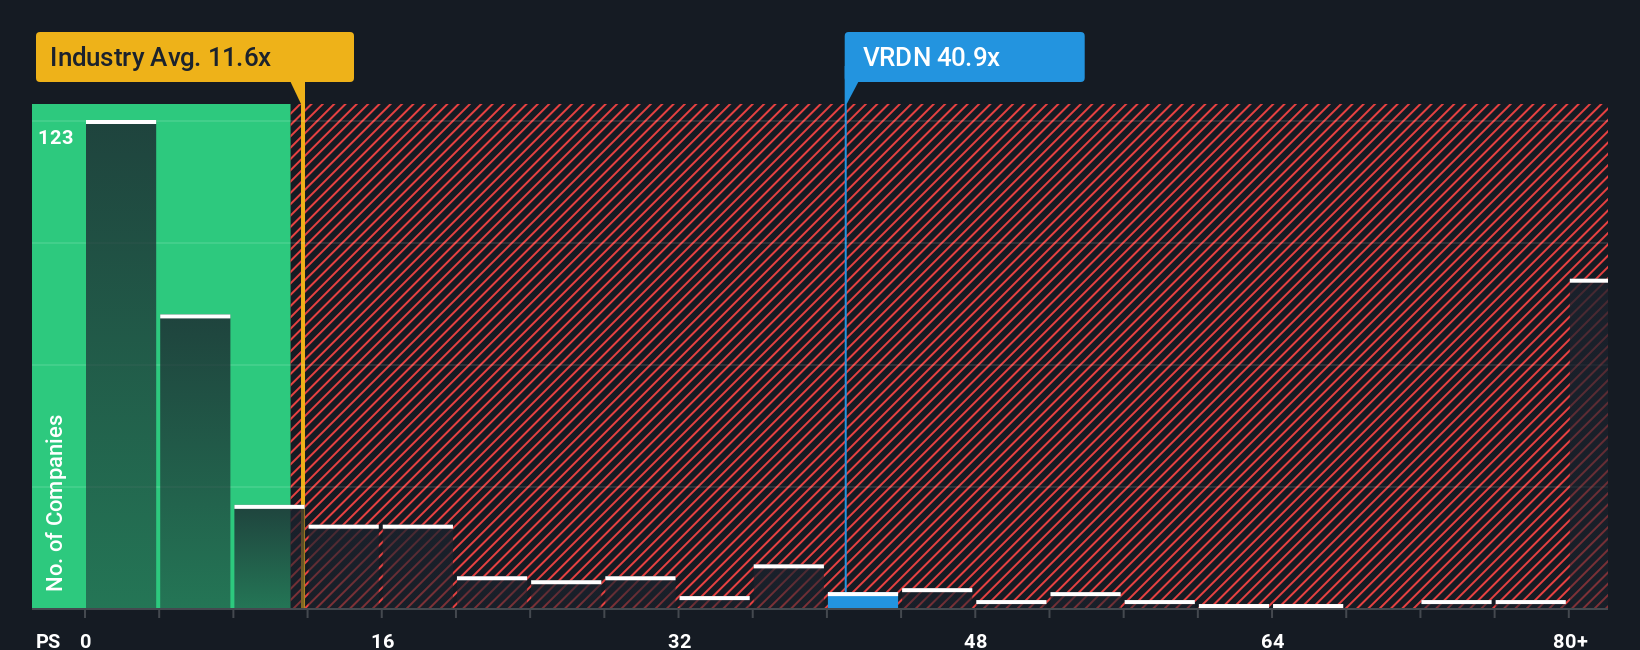
Following the firm bounce in price, Viridian Therapeutics' price-to-sales (or "P/S") ratio of 40.9x might make it look like a strong sell right now compared to other companies in the Biotechs industry in the United States, where around half of the companies have P/S ratios below 11.6x and even P/S below 4x are quite common. However, the P/S might be quite high for a reason and it requires further investigation to determine if it's justified.
View our latest analysis for Viridian Therapeutics
How Has Viridian Therapeutics Performed Recently?
Recent times have been advantageous for Viridian Therapeutics as its revenues have been rising faster than most other companies. It seems the market expects this form will continue into the future, hence the elevated P/S ratio. You'd really hope so, otherwise you're paying a pretty hefty price for no particular reason.
Keen to find out how analysts think Viridian Therapeutics' future stacks up against the industry? In that case, our free report is a great place to start.How Is Viridian Therapeutics' Revenue Growth Trending?
Viridian Therapeutics' P/S ratio would be typical for a company that's expected to deliver very strong growth, and importantly, perform much better than the industry.
Taking a look back first, we see that the company's revenues underwent some rampant growth over the last 12 months. Spectacularly, three year revenue growth has also set the world alight, thanks to the last 12 months of incredible growth. So we can start by confirming that the company has done a tremendous job of growing revenue over that time.
Shifting to the future, estimates from the analysts covering the company suggest revenue should grow by 106% each year over the next three years. With the industry predicted to deliver 122% growth per year, the company is positioned for a weaker revenue result.
In light of this, it's alarming that Viridian Therapeutics' P/S sits above the majority of other companies. Apparently many investors in the company are way more bullish than analysts indicate and aren't willing to let go of their stock at any price. There's a good chance these shareholders are setting themselves up for future disappointment if the P/S falls to levels more in line with the growth outlook.
What We Can Learn From Viridian Therapeutics' P/S?
Shares in Viridian Therapeutics have seen a strong upwards swing lately, which has really helped boost its P/S figure. It's argued the price-to-sales ratio is an inferior measure of value within certain industries, but it can be a powerful business sentiment indicator.
Despite analysts forecasting some poorer-than-industry revenue growth figures for Viridian Therapeutics, this doesn't appear to be impacting the P/S in the slightest. When we see a weak revenue outlook, we suspect the share price faces a much greater risk of declining, bringing back down the P/S figures. Unless these conditions improve markedly, it's very challenging to accept these prices as being reasonable.
You should always think about risks. Case in point, we've spotted 1 warning sign for Viridian Therapeutics you should be aware of.
If strong companies turning a profit tickle your fancy, then you'll want to check out this free list of interesting companies that trade on a low P/E (but have proven they can grow earnings).
New: Manage All Your Stock Portfolios in One Place
We've created the ultimate portfolio companion for stock investors, and it's free.
• Connect an unlimited number of Portfolios and see your total in one currency
• Be alerted to new Warning Signs or Risks via email or mobile
• Track the Fair Value of your stocks
Have feedback on this article? Concerned about the content? Get in touch with us directly. Alternatively, email editorial-team (at) simplywallst.com.
This article by Simply Wall St is general in nature. We provide commentary based on historical data and analyst forecasts only using an unbiased methodology and our articles are not intended to be financial advice. It does not constitute a recommendation to buy or sell any stock, and does not take account of your objectives, or your financial situation. We aim to bring you long-term focused analysis driven by fundamental data. Note that our analysis may not factor in the latest price-sensitive company announcements or qualitative material. Simply Wall St has no position in any stocks mentioned.
About NasdaqCM:VRDN
Viridian Therapeutics
Engages in discovering, developing, and commercializing treatments for serious and rare diseases.
High growth potential with excellent balance sheet.
Market Insights

Advertisement
Community Narratives
MicroVision will explode future revenue by 380.37% with a vision towards success
Fair Value US$60.00|98.4% undervalued
TH
Community Contributor
The Indispensable Artery for a New North American Economy
Fair Value CA$132.87|1.3% undervalued
TI
Community Contributor