
Advertisement
- United States
- /
- Biotech
- /
- NasdaqGS:SNDX
Syndax Pharmaceuticals, Inc.'s (NASDAQ:SNDX) Shares Climb 29% But Its Business Is Yet to Catch Up
Syndax Pharmaceuticals, Inc. (NASDAQ:SNDX) shares have had a really impressive month, gaining 29% after a shaky period beforehand. Notwithstanding the latest gain, the annual share price return of 8.4% isn't as impressive.
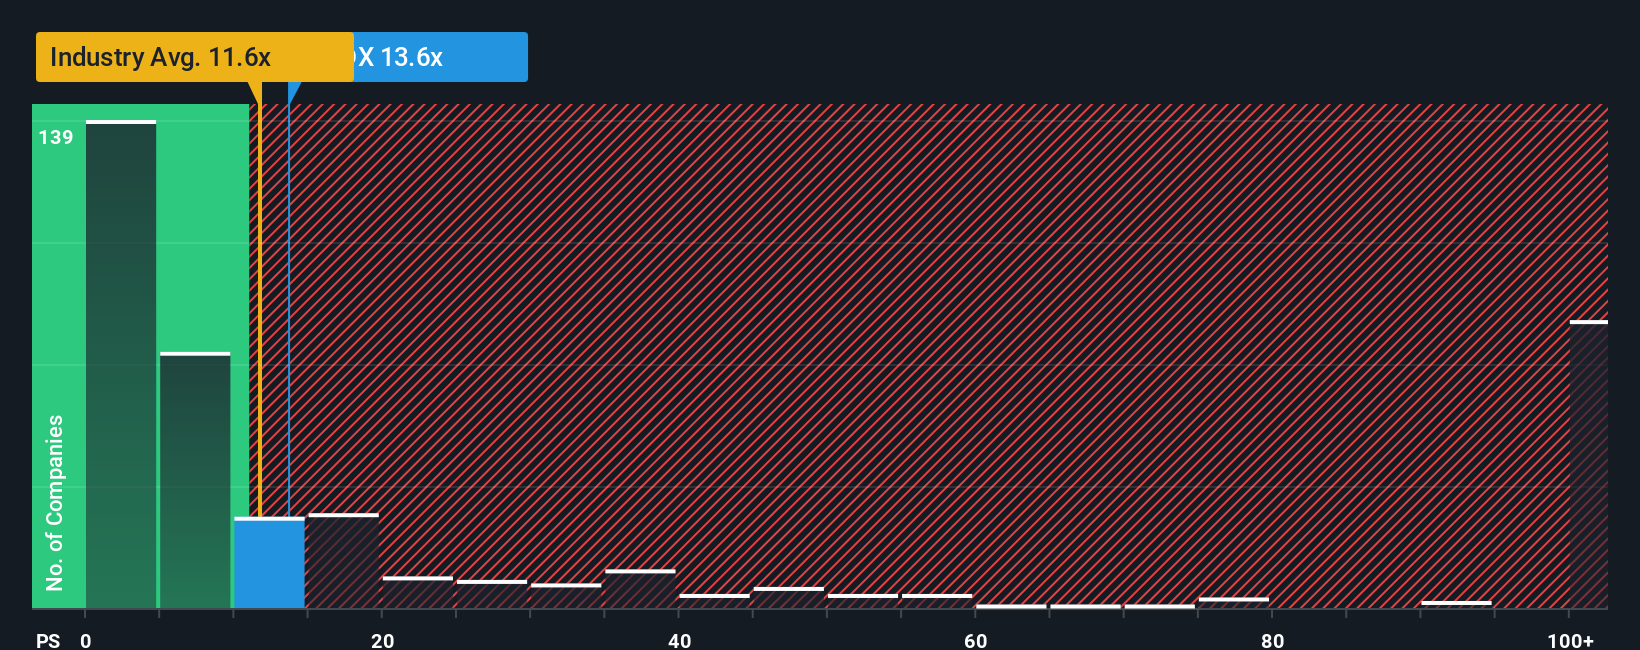
Even after such a large jump in price, it's still not a stretch to say that Syndax Pharmaceuticals' price-to-sales (or "P/S") ratio of 13.6x right now seems quite "middle-of-the-road" compared to the Biotechs industry in the United States, where the median P/S ratio is around 11.6x. While this might not raise any eyebrows, if the P/S ratio is not justified investors could be missing out on a potential opportunity or ignoring looming disappointment.
View our latest analysis for Syndax Pharmaceuticals
How Has Syndax Pharmaceuticals Performed Recently?
With revenue growth that's superior to most other companies of late, Syndax Pharmaceuticals has been doing relatively well. Perhaps the market is expecting this level of performance to taper off, keeping the P/S from soaring. If the company manages to stay the course, then investors should be rewarded with a share price that matches its revenue figures.
Want the full picture on analyst estimates for the company? Then our free report on Syndax Pharmaceuticals will help you uncover what's on the horizon.What Are Revenue Growth Metrics Telling Us About The P/S?
The only time you'd be comfortable seeing a P/S like Syndax Pharmaceuticals' is when the company's growth is tracking the industry closely.
If we review the last year of revenue growth, we see the company's revenues grew exponentially. Despite this strong recent growth, it's still struggling to catch up as its three-year revenue frustratingly shrank by 12% overall. So unfortunately, we have to acknowledge that the company has not done a great job of growing revenues over that time.
Looking ahead now, revenue is anticipated to climb by 84% each year during the coming three years according to the twelve analysts following the company. Meanwhile, the rest of the industry is forecast to expand by 124% each year, which is noticeably more attractive.
With this in mind, we find it intriguing that Syndax Pharmaceuticals' P/S is closely matching its industry peers. It seems most investors are ignoring the fairly limited growth expectations and are willing to pay up for exposure to the stock. These shareholders may be setting themselves up for future disappointment if the P/S falls to levels more in line with the growth outlook.
What We Can Learn From Syndax Pharmaceuticals' P/S?
Its shares have lifted substantially and now Syndax Pharmaceuticals' P/S is back within range of the industry median. Using the price-to-sales ratio alone to determine if you should sell your stock isn't sensible, however it can be a practical guide to the company's future prospects.
Given that Syndax Pharmaceuticals' revenue growth projections are relatively subdued in comparison to the wider industry, it comes as a surprise to see it trading at its current P/S ratio. When we see companies with a relatively weaker revenue outlook compared to the industry, we suspect the share price is at risk of declining, sending the moderate P/S lower. A positive change is needed in order to justify the current price-to-sales ratio.
Many other vital risk factors can be found on the company's balance sheet. Take a look at our free balance sheet analysis for Syndax Pharmaceuticals with six simple checks on some of these key factors.
It's important to make sure you look for a great company, not just the first idea you come across. So if growing profitability aligns with your idea of a great company, take a peek at this free list of interesting companies with strong recent earnings growth (and a low P/E).
New: Manage All Your Stock Portfolios in One Place
We've created the ultimate portfolio companion for stock investors, and it's free.
• Connect an unlimited number of Portfolios and see your total in one currency
• Be alerted to new Warning Signs or Risks via email or mobile
• Track the Fair Value of your stocks
Have feedback on this article? Concerned about the content? Get in touch with us directly. Alternatively, email editorial-team (at) simplywallst.com.
This article by Simply Wall St is general in nature. We provide commentary based on historical data and analyst forecasts only using an unbiased methodology and our articles are not intended to be financial advice. It does not constitute a recommendation to buy or sell any stock, and does not take account of your objectives, or your financial situation. We aim to bring you long-term focused analysis driven by fundamental data. Note that our analysis may not factor in the latest price-sensitive company announcements or qualitative material. Simply Wall St has no position in any stocks mentioned.
About NasdaqGS:SNDX
Syndax Pharmaceuticals
A commercial-stage biopharmaceutical company, develops therapies for the treatment of cancer.
High growth potential with adequate balance sheet.
Market Insights

Advertisement
Community Narratives
MicroVision will explode future revenue by 380.37% with a vision towards success
Fair Value US$60.00|98.4% undervalued
TH
Community Contributor
The Indispensable Artery for a New North American Economy
Fair Value CA$132.87|1.3% undervalued
TI
Community Contributor