Advertisement
- United States
- /
- Biotech
- /
- NasdaqGS:SNDX
How the Latest Pipeline News Impacts the Value Story for Syndax Pharmaceuticals in 2025

Simply Wall St
Reviewed by Bailey Pemberton
- Wondering if Syndax Pharmaceuticals is a bargain or just treading water? You are not alone, as plenty of investors are seeking clarity on its current valuation story.
- The stock has seen some notable ups and downs recently. It rose 1.3% over the last week but remains down 12.2% in the past month and nearly 28% over the last year, reflecting shifting market expectations around growth and risk.
- Much of this volatility has been driven by news about pipeline developments, specifically updates on the company's lead clinical programs and new partnership announcements, which have attracted investor attention. These headlines continue to influence sentiment as stakeholders weigh the potential impact of drug approvals against ongoing uncertainties in the biotech sector.
- In summary, Syndax currently scores 3 out of 6 on our valuation checks, so there is room for debate about how attractive the price is. Let us explore traditional valuation methods next, then consider a more detailed way to assess whether the stock is truly undervalued.
Find out why Syndax Pharmaceuticals's -27.8% return over the last year is lagging behind its peers.
Approach 1: Syndax Pharmaceuticals Discounted Cash Flow (DCF) Analysis
The Discounted Cash Flow (DCF) approach attempts to estimate the intrinsic value of Syndax Pharmaceuticals by projecting its future cash flows and then discounting them back to their present value. In essence, this model tries to determine what the company is truly worth today, based on its future expected ability to generate cash.
Currently, Syndax’s Free Cash Flow (FCF) stands at around -$303 Million, an indication that operating costs and investments are significantly outpacing incoming cash. Analysts offer estimates out to 2029, where FCF is projected at $351 Million. Beyond analyst forecasts, projections are extended for another five years, with FCF expected to climb to roughly $1.26 Billion by 2035. These figures rely more on extrapolation than consensus forecasts.
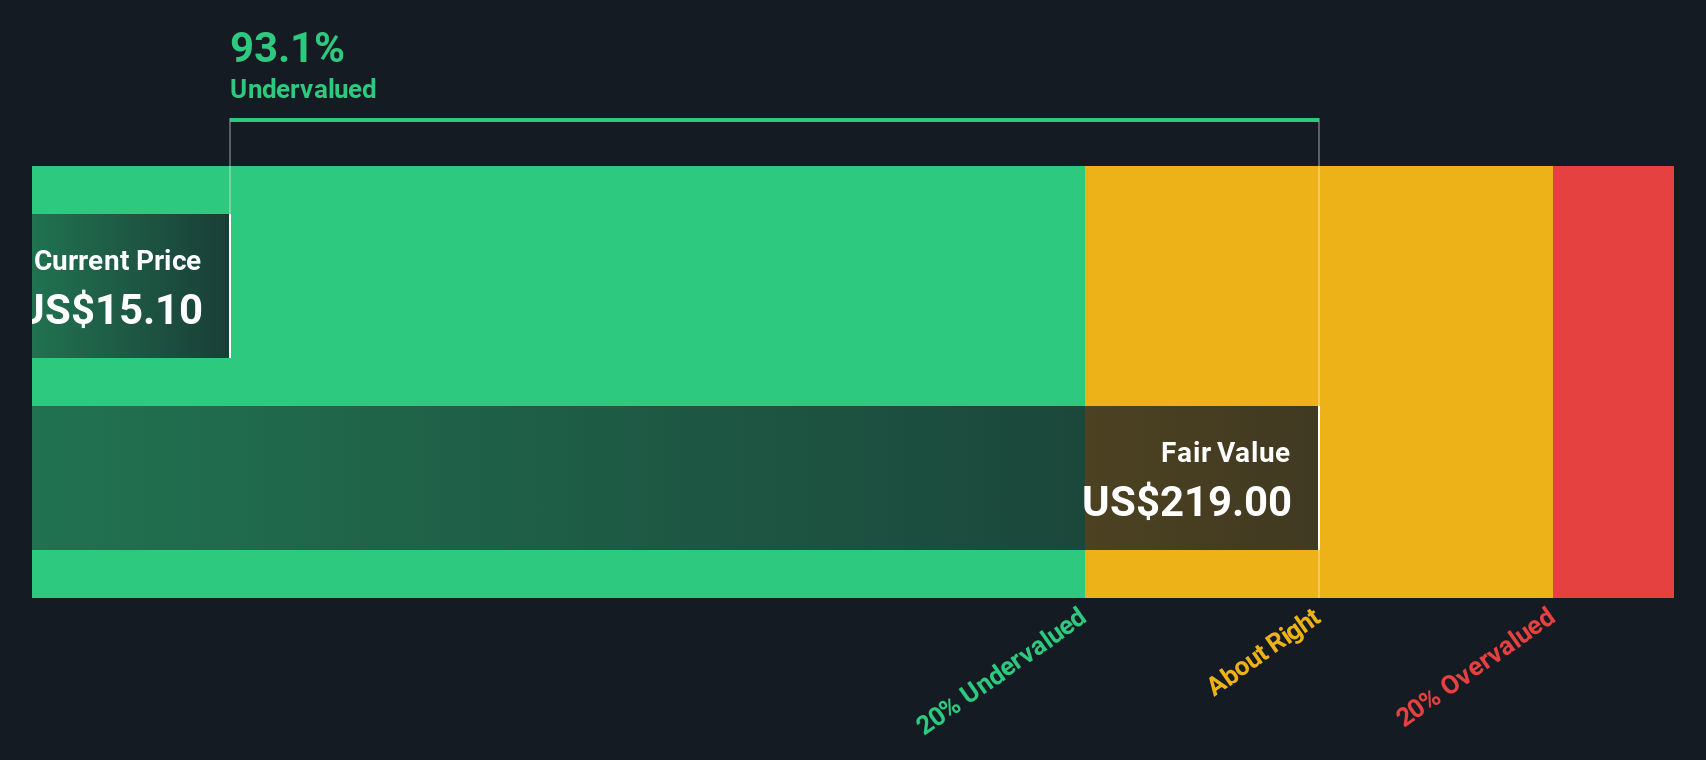
Using a two-stage Free Cash Flow to Equity model, the resulting intrinsic value per share is calculated as $209.92. At the current share price, this implies a 93.5% discount relative to the estimated fair value of Syndax Pharmaceuticals.
The DCF analysis highlights significant potential upside for investors willing to tolerate risk and uncertainty in future cash flows.
Result: UNDERVALUED
Our Discounted Cash Flow (DCF) analysis suggests Syndax Pharmaceuticals is undervalued by 93.5%. Track this in your watchlist or portfolio, or discover 840 more undervalued stocks based on cash flows.
Approach 2: Syndax Pharmaceuticals Price vs Sales
The Price-to-Sales (P/S) ratio is often used as a valuation metric for companies like Syndax Pharmaceuticals, especially when they are not consistently profitable but do generate significant revenue. For profitable firms, valuation multiples such as P/E or P/S help anchor expectations against the underlying business performance and enable easier comparison across the sector.
Growth expectations and risk play a big role in what’s considered a “normal” or “fair” multiple. High-growth or lower-risk companies frequently justify a higher P/S ratio as investors anticipate stronger future returns, while firms with slower growth or higher uncertainty usually trade at a discount.
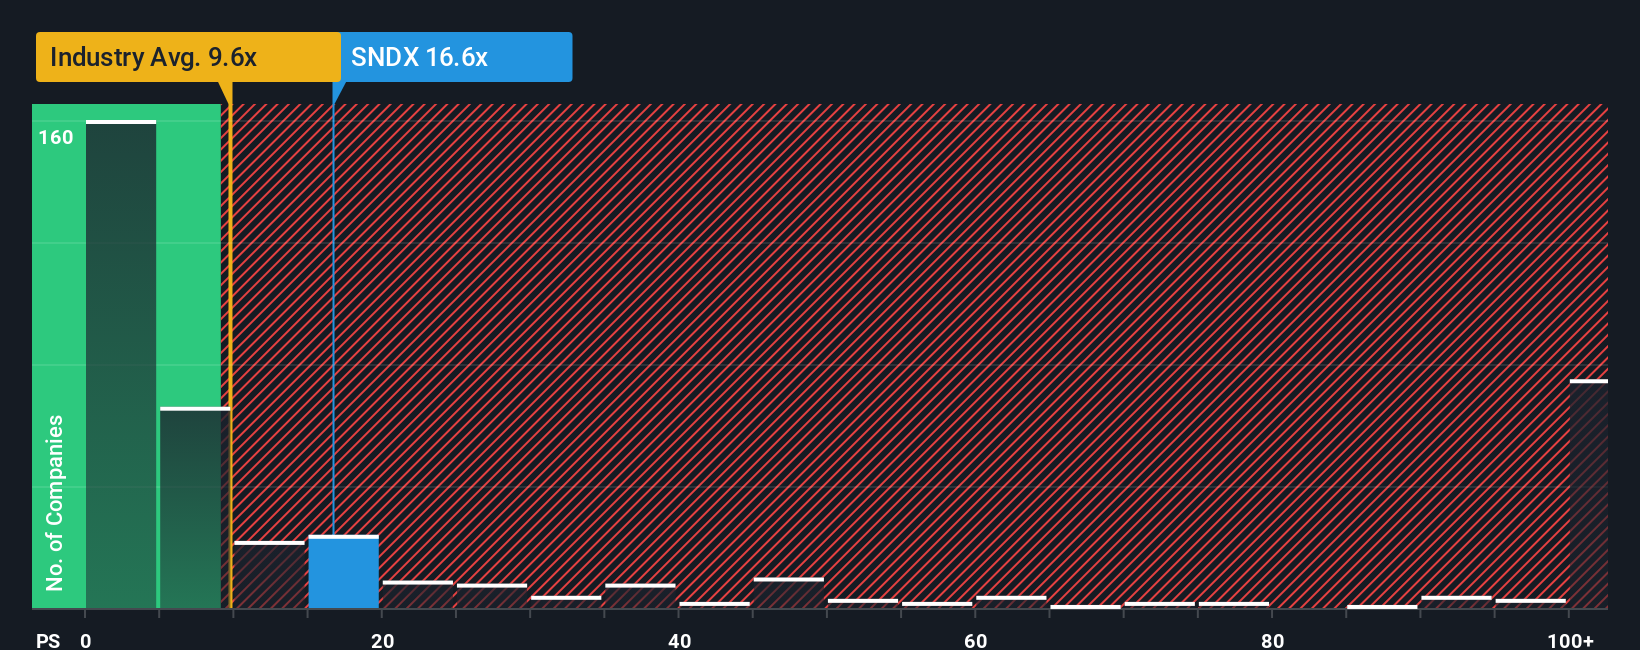
Syndax currently trades at a P/S ratio of 15.14x. This is above the biotech industry average of 11.18x, but below the peer group average of 20.36x. On the surface, this suggests the market is pricing in higher growth or stronger prospects than the industry, but perhaps not to the degree of its closest competitors.
To dig deeper, Simply Wall St’s proprietary “Fair Ratio” combines factors like earnings growth, profit margin, industry dynamics, market cap and risk profile to generate a more tailored benchmark. Unlike standard industry or peer comparisons, this Fair Ratio gives a truer sense of what’s justified for Syndax specifically. For Syndax, the Fair Ratio for P/S is 14.76x.
Comparing actual and Fair Ratios, there is a minimal gap between them. The stock trades at 15.14x versus a fair value of 14.76x. This price is about right given Syndax’s profile and sector outlook.
Result: ABOUT RIGHT
PS ratios tell one story, but what if the real opportunity lies elsewhere? Discover 1414 companies where insiders are betting big on explosive growth.
Upgrade Your Decision Making: Choose your Syndax Pharmaceuticals Narrative
Earlier we mentioned there is an even better way to understand valuation, so let us introduce you to Narratives. A Narrative is a simple, powerful tool that lets you explain the story behind the numbers. It connects your perspective on Syndax Pharmaceuticals’ future revenue, earnings, and margins with a financial forecast and an estimated fair value.
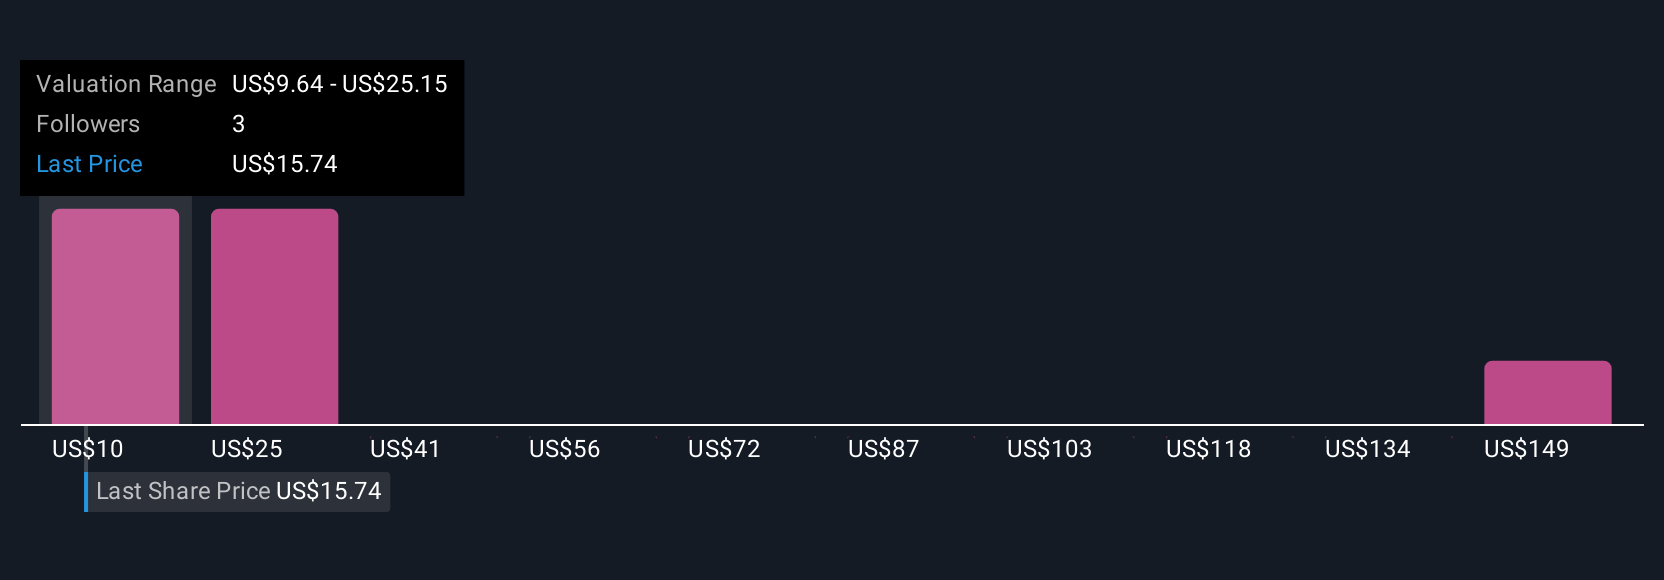
Instead of only relying on static numbers, Narratives help you make buy or sell decisions by comparing your own Fair Value to the current market price, all within the Simply Wall St Community page used by millions of investors worldwide. Narratives are always up to date, reacting as the latest news or results are released, so your view can change with new information. For Syndax Pharmaceuticals, for example, one investor’s optimistic Narrative might use the highest analyst estimates and project a fair value near $56, while a more cautious Narrative could align with the lowest forecast and a fair value closer to $19. This shows how different stories lead to different investment decisions.
Do you think there's more to the story for Syndax Pharmaceuticals? Head over to our Community to see what others are saying!
This article by Simply Wall St is general in nature. We provide commentary based on historical data and analyst forecasts only using an unbiased methodology and our articles are not intended to be financial advice. It does not constitute a recommendation to buy or sell any stock, and does not take account of your objectives, or your financial situation. We aim to bring you long-term focused analysis driven by fundamental data. Note that our analysis may not factor in the latest price-sensitive company announcements or qualitative material. Simply Wall St has no position in any stocks mentioned.
New: Manage All Your Stock Portfolios in One Place
We've created the ultimate portfolio companion for stock investors, and it's free.
• Connect an unlimited number of Portfolios and see your total in one currency
• Be alerted to new Warning Signs or Risks via email or mobile
• Track the Fair Value of your stocks
Have feedback on this article? Concerned about the content? Get in touch with us directly. Alternatively, email editorial-team@simplywallst.com
About NasdaqGS:SNDX
Syndax Pharmaceuticals
A commercial-stage biopharmaceutical company, develops therapies for the treatment of cancer.
High growth potential with adequate balance sheet.
Market Insights

Advertisement
Community Narratives
The company that turned a verb into a global necessity and basically runs the modern internet, digital ads, smartphones, maps, and AI.
Fair Value US$300.00|6.3% undervalued
OS
Community Contributor
Flowers Foods Pays A Fair Price For Health
Fair Value US$16.12|26.0% undervalued
NV
Community Contributor
TMX Group will thrive with 33.3% profit margin and enduring market moat
Fair Value CA$49.90|3.7% overvalued
LI
Community Contributor