
Advertisement
- United States
- /
- Biotech
- /
- NasdaqCM:SGMO
Revenues Working Against Sangamo Therapeutics, Inc.'s (NASDAQ:SGMO) Share Price Following 33% Dive
Sangamo Therapeutics, Inc. (NASDAQ:SGMO) shares have had a horrible month, losing 33% after a relatively good period beforehand. The recent drop completes a disastrous twelve months for shareholders, who are sitting on a 77% loss during that time.
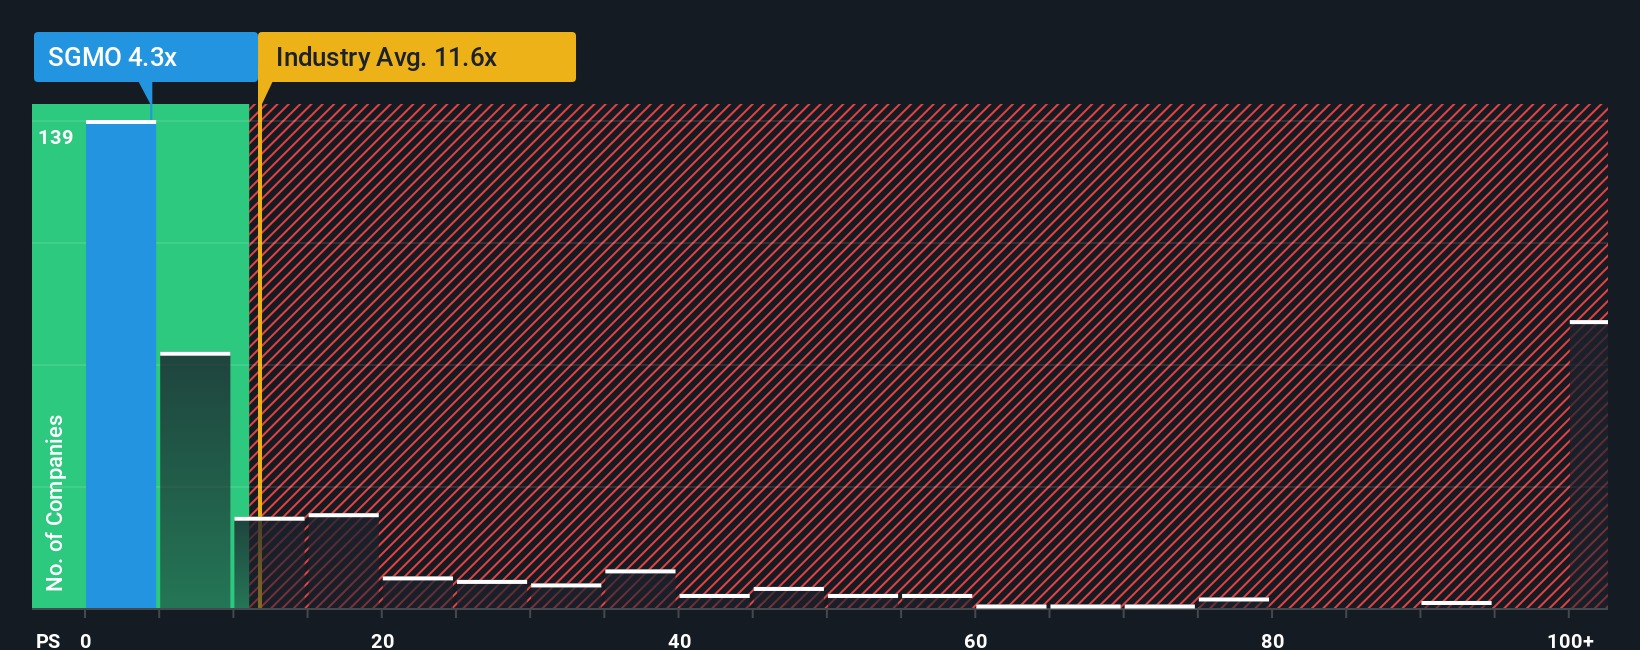
After such a large drop in price, Sangamo Therapeutics may look like a strong buying opportunity at present with its price-to-sales (or "P/S") ratio of 4.3x, considering almost half of all companies in the Biotechs industry in the United States have P/S ratios greater than 11.6x and even P/S higher than 104x aren't out of the ordinary. Although, it's not wise to just take the P/S at face value as there may be an explanation why it's so limited.
View our latest analysis for Sangamo Therapeutics
How Has Sangamo Therapeutics Performed Recently?
While the industry has experienced revenue growth lately, Sangamo Therapeutics' revenue has gone into reverse gear, which is not great. It seems that many are expecting the poor revenue performance to persist, which has repressed the P/S ratio. If you still like the company, you'd be hoping this isn't the case so that you could potentially pick up some stock while it's out of favour.
If you'd like to see what analysts are forecasting going forward, you should check out our free report on Sangamo Therapeutics.How Is Sangamo Therapeutics' Revenue Growth Trending?
In order to justify its P/S ratio, Sangamo Therapeutics would need to produce anemic growth that's substantially trailing the industry.
In reviewing the last year of financials, we were disheartened to see the company's revenues fell to the tune of 37%. This means it has also seen a slide in revenue over the longer-term as revenue is down 71% in total over the last three years. Accordingly, shareholders would have felt downbeat about the medium-term rates of revenue growth.
Looking ahead now, revenue is anticipated to climb by 79% per year during the coming three years according to the five analysts following the company. That's shaping up to be materially lower than the 124% each year growth forecast for the broader industry.
With this information, we can see why Sangamo Therapeutics is trading at a P/S lower than the industry. It seems most investors are expecting to see limited future growth and are only willing to pay a reduced amount for the stock.
The Final Word
Sangamo Therapeutics' P/S looks about as weak as its stock price lately. We'd say the price-to-sales ratio's power isn't primarily as a valuation instrument but rather to gauge current investor sentiment and future expectations.
We've established that Sangamo Therapeutics maintains its low P/S on the weakness of its forecast growth being lower than the wider industry, as expected. Right now shareholders are accepting the low P/S as they concede future revenue probably won't provide any pleasant surprises. It's hard to see the share price rising strongly in the near future under these circumstances.
You need to take note of risks, for example - Sangamo Therapeutics has 3 warning signs (and 2 which are significant) we think you should know about.
It's important to make sure you look for a great company, not just the first idea you come across. So if growing profitability aligns with your idea of a great company, take a peek at this free list of interesting companies with strong recent earnings growth (and a low P/E).
New: Manage All Your Stock Portfolios in One Place
We've created the ultimate portfolio companion for stock investors, and it's free.
• Connect an unlimited number of Portfolios and see your total in one currency
• Be alerted to new Warning Signs or Risks via email or mobile
• Track the Fair Value of your stocks
Have feedback on this article? Concerned about the content? Get in touch with us directly. Alternatively, email editorial-team (at) simplywallst.com.
This article by Simply Wall St is general in nature. We provide commentary based on historical data and analyst forecasts only using an unbiased methodology and our articles are not intended to be financial advice. It does not constitute a recommendation to buy or sell any stock, and does not take account of your objectives, or your financial situation. We aim to bring you long-term focused analysis driven by fundamental data. Note that our analysis may not factor in the latest price-sensitive company announcements or qualitative material. Simply Wall St has no position in any stocks mentioned.
About NasdaqCM:SGMO
Sangamo Therapeutics
A clinical-stage genomic medicine company, focuses on translating science into medicines that transform the lives of patients and families afflicted with serious diseases in the United States.
High growth potential and good value.
Similar Companies
Market Insights

Advertisement
Community Narratives
MicroVision will explode future revenue by 380.37% with a vision towards success
Fair Value US$60.00|98.4% undervalued
TH
Community Contributor
The Indispensable Artery for a New North American Economy
Fair Value CA$132.87|1.3% undervalued
TI
Community Contributor