Advertisement
- United States
- /
- Biotech
- /
- NasdaqGM:RNA
Is Avidity Biosciences Still Attractive After FDA Clearance and 42% Weekly Price Surge?

Simply Wall St
Reviewed by Bailey Pemberton
- Wondering if Avidity Biosciences is a hidden gem or just riding a wave? You are not alone, as many investors are asking if the stock's price truly reflects its underlying value.
- The share price has skyrocketed lately, jumping 42.1% in just the past week and up an impressive 124.0% year-to-date, with a 3-year gain of 415.1%.
- Avidity Biosciences has caught attention after securing fresh FDA clearance to expand its clinical pipeline for RNA-targeted therapies, sparking optimism about its long-term growth. Investors are also buzzing about recent collaborations the company announced with larger biotech firms, further boosting market sentiment.
- Despite all the excitement, Avidity scores just 0 out of 6 on our valuation checks. This means it is not currently undervalued by any of our standard measures. Let's dig into the numbers with classic valuation tools, but stay tuned as we will also explore a smarter way to think about fair value by the end of this article.
Avidity Biosciences scores just 0/6 on our valuation checks. See what other red flags we found in the full valuation breakdown.
Approach 1: Avidity Biosciences Discounted Cash Flow (DCF) Analysis
A Discounted Cash Flow (DCF) model estimates the value of a company by projecting its future cash flows and discounting them back to today's dollars. This approach offers insight into whether the market price reflects the company's ability to generate cash over time.
For Avidity Biosciences, the latest reported Free Cash Flow is negative at $-496.6 million. Analyst estimates extend up to 2029, indicating cash flows will remain negative until that point, with a swing into positive territory of $127.3 million projected for 2029. Beyond these analyst forecasts, longer-term projections are extrapolated, reaching $375.9 million in 2035. All values are reported in US dollars.
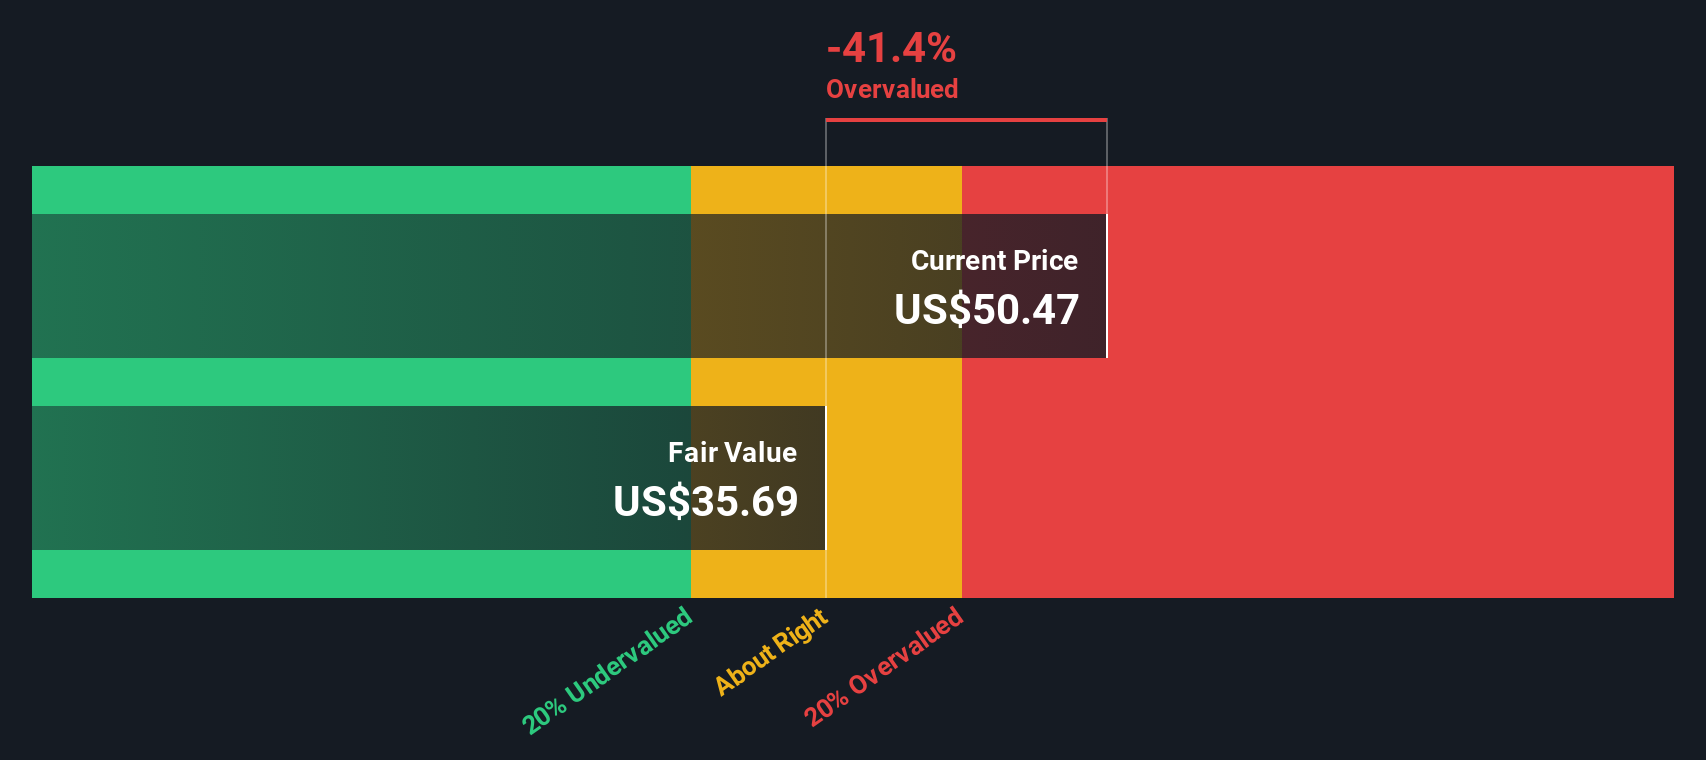
Simply Wall St’s two-stage Free Cash Flow to Equity model calculates Avidity’s intrinsic value at $34.21 per share. However, the current share price is 104.2% above this estimated fair value, suggesting the stock is significantly overvalued according to this model.
Result: OVERVALUED
Our Discounted Cash Flow (DCF) analysis suggests Avidity Biosciences may be overvalued by 104.2%. Discover 832 undervalued stocks or create your own screener to find better value opportunities.
Approach 2: Avidity Biosciences Price vs Book
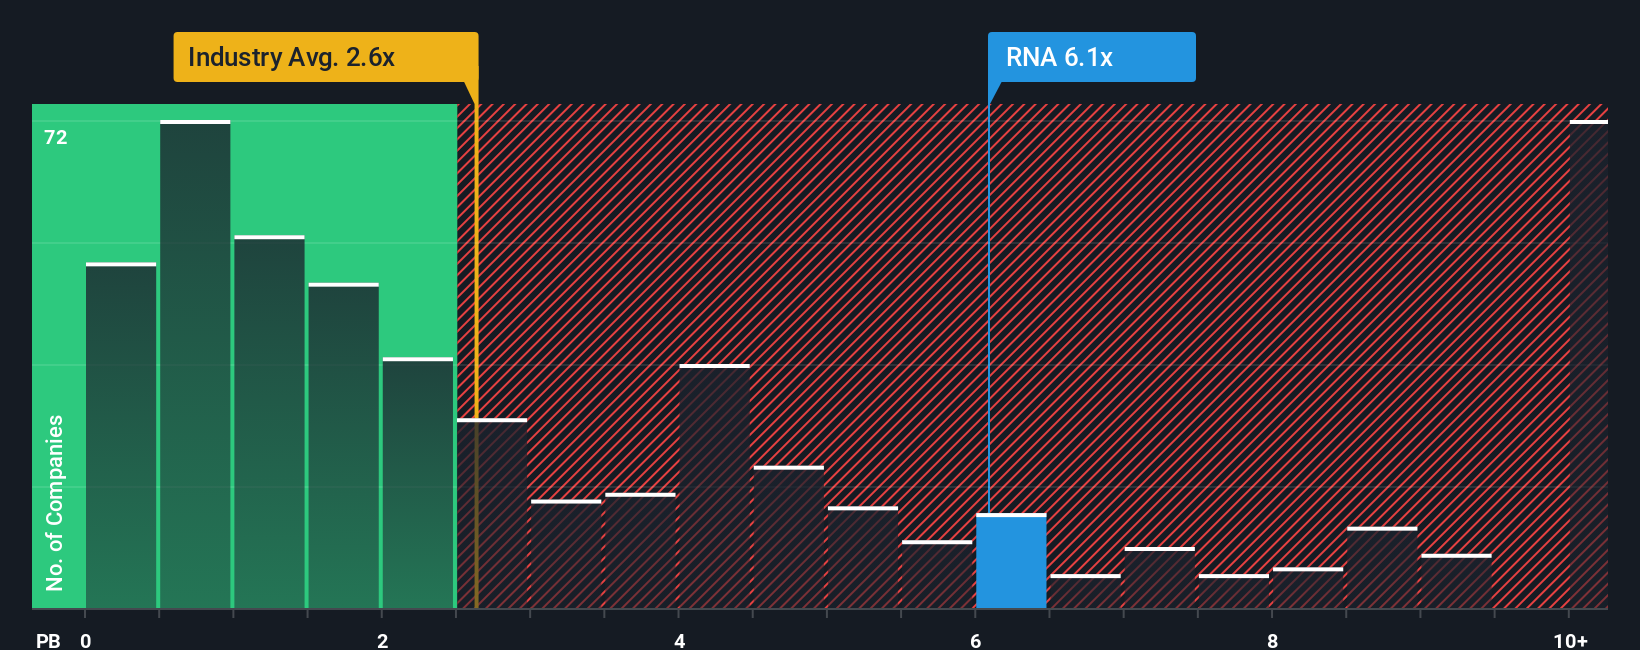
The price-to-book (P/B) ratio is a widely used valuation metric, especially for biotechnology and early-stage companies where profits may not yet be consistent or positive. This ratio compares a company’s market value to its net asset value, making it a handy reference for valuing assets in industries where earnings are volatile or negative.
Growth expectations and risk play a major role in what is considered a “normal” or “fair” P/B multiple. Higher growth prospects or lower risk profiles typically justify a higher ratio, while slower growth or greater risks should result in a lower one. For context, Avidity Biosciences currently trades at a P/B ratio of 8.41x. The average among peers sits at 7.70x, while the broader biotechs industry average is 2.53x.
Simply Wall St’s Fair Ratio takes things a step further than typical peer or industry comparisons. It estimates what a reasonable P/B multiple should be for Avidity, based on a fuller picture including growth potential, risk factors, profit margins, market capitalization, and where the company sits within its industry. This proprietary metric aims to deliver a more tailored value benchmark for each company and capture subtle nuances the broader averages can miss.
Comparing Avidity Biosciences’ actual P/B ratio to the Fair Ratio provides a clearer sense of relative value. In this case, the Fair Ratio is not available. While Avidity’s P/B is above both peers and the industry, it is difficult to draw a firm conclusion about true value without that sharper lens.
Result: OVERVALUED
PB ratios tell one story, but what if the real opportunity lies elsewhere? Discover 1410 companies where insiders are betting big on explosive growth.
Upgrade Your Decision Making: Choose your Avidity Biosciences Narrative
Earlier, we mentioned that there is an even better way to understand valuation. Let’s introduce you to Narratives. A Narrative is a clear, personalized story that you create to explain your view of a company’s future, linking your beliefs about its business potential to estimates of revenue, earnings, and ultimately its fair value.
Narratives connect a company’s unique journey, such as breakthroughs, risks, or partnerships, to actual financial forecasts and a valuation you can stand behind. They make investing more approachable by combining facts with your interpretation, and are offered as an easy-to-use tool in Simply Wall St’s Community page, where millions of investors share their views.
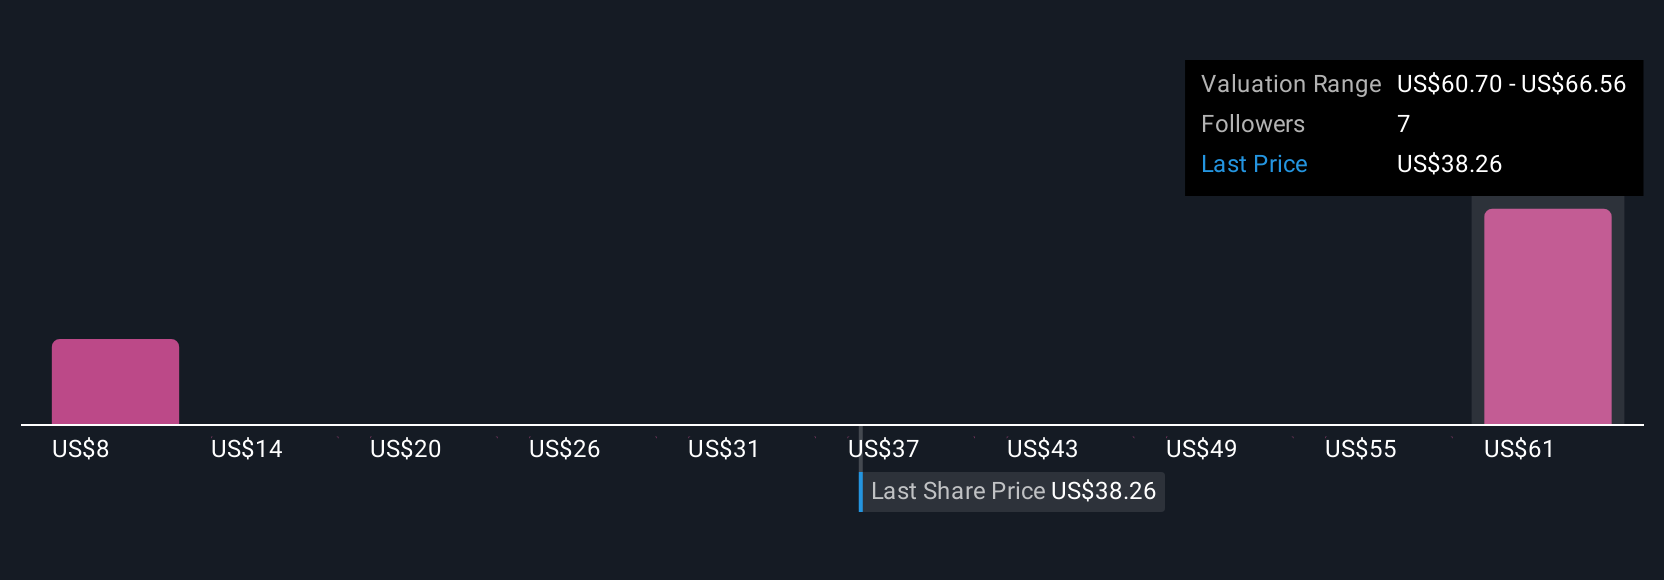
By comparing your Narrative’s fair value with the current market price, you can see exactly when an opportunity to buy or sell may appear. Since Narratives update as new news or results are released, your view always stays relevant. For example, some investors see Avidity Biosciences’ fair value as high as $60 per share based on aggressive revenue growth, while the lowest see it closer to $12 based on risk concerns and slower progress.
This dynamic approach empowers you to make more informed and confident investment decisions that move beyond just the numbers.
Do you think there's more to the story for Avidity Biosciences? Head over to our Community to see what others are saying!
This article by Simply Wall St is general in nature. We provide commentary based on historical data and analyst forecasts only using an unbiased methodology and our articles are not intended to be financial advice. It does not constitute a recommendation to buy or sell any stock, and does not take account of your objectives, or your financial situation. We aim to bring you long-term focused analysis driven by fundamental data. Note that our analysis may not factor in the latest price-sensitive company announcements or qualitative material. Simply Wall St has no position in any stocks mentioned.
New: Manage All Your Stock Portfolios in One Place
We've created the ultimate portfolio companion for stock investors, and it's free.
• Connect an unlimited number of Portfolios and see your total in one currency
• Be alerted to new Warning Signs or Risks via email or mobile
• Track the Fair Value of your stocks
Have feedback on this article? Concerned about the content? Get in touch with us directly. Alternatively, email editorial-team@simplywallst.com
About NasdaqGM:RNA
Avidity Biosciences
A biopharmaceutical company, engages in the delivery of RNA therapeutics called antibody oligonucleotide conjugates (AOCs).
Flawless balance sheet with low risk.
Similar Companies
Market Insights

Advertisement
Community Narratives
The company that turned a verb into a global necessity and basically runs the modern internet, digital ads, smartphones, maps, and AI.
Fair Value US$300.00|6.3% undervalued
OS
Community Contributor
Flowers Foods Pays A Fair Price For Health
Fair Value US$16.12|26.0% undervalued
NV
Community Contributor
TMX Group will thrive with 33.3% profit margin and enduring market moat
Fair Value CA$49.90|3.7% overvalued
LI
Community Contributor