
Advertisement
- United States
- /
- Biotech
- /
- OTCPK:MTEM.Q
Little Excitement Around Molecular Templates, Inc.'s (NASDAQ:MTEM) Revenues As Shares Take 48% Pounding
Molecular Templates, Inc. (NASDAQ:MTEM) shareholders that were waiting for something to happen have been dealt a blow with a 48% share price drop in the last month. For any long-term shareholders, the last month ends a year to forget by locking in a 69% share price decline.
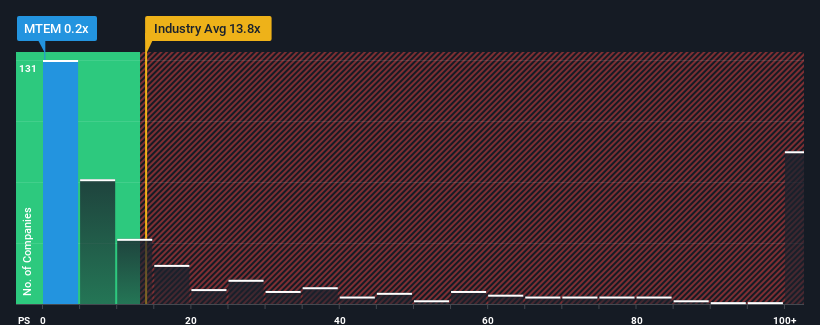
Since its price has dipped substantially, Molecular Templates may look like a strong buying opportunity at present with its price-to-sales (or "P/S") ratio of 0.2x, considering almost half of all companies in the Biotechs industry in the United States have P/S ratios greater than 13.8x and even P/S higher than 74x aren't out of the ordinary. However, the P/S might be quite low for a reason and it requires further investigation to determine if it's justified.
View our latest analysis for Molecular Templates
What Does Molecular Templates' Recent Performance Look Like?
There hasn't been much to differentiate Molecular Templates' and the industry's revenue growth lately. Perhaps the market is expecting future revenue performance to dive, which has kept the P/S suppressed. If not, then existing shareholders have reason to be optimistic about the future direction of the share price.
Keen to find out how analysts think Molecular Templates' future stacks up against the industry? In that case, our free report is a great place to start.What Are Revenue Growth Metrics Telling Us About The Low P/S?
The only time you'd be truly comfortable seeing a P/S as depressed as Molecular Templates' is when the company's growth is on track to lag the industry decidedly.
If we review the last year of revenue growth, the company posted a terrific increase of 190%. The strong recent performance means it was also able to grow revenue by 204% in total over the last three years. So we can start by confirming that the company has done a great job of growing revenue over that time.
Shifting to the future, estimates from the one analyst covering the company suggest revenue growth is heading into negative territory, declining 78% over the next year. With the industry predicted to deliver 147% growth, that's a disappointing outcome.
With this in consideration, we find it intriguing that Molecular Templates' P/S is closely matching its industry peers. Nonetheless, there's no guarantee the P/S has reached a floor yet with revenue going in reverse. Even just maintaining these prices could be difficult to achieve as the weak outlook is weighing down the shares.
What We Can Learn From Molecular Templates' P/S?
Molecular Templates' P/S looks about as weak as its stock price lately. While the price-to-sales ratio shouldn't be the defining factor in whether you buy a stock or not, it's quite a capable barometer of revenue expectations.
With revenue forecasts that are inferior to the rest of the industry, it's no surprise that Molecular Templates' P/S is on the lower end of the spectrum. As other companies in the industry are forecasting revenue growth, Molecular Templates' poor outlook justifies its low P/S ratio. Unless there's material change, it's hard to envision a situation where the stock price will rise drastically.
Before you take the next step, you should know about the 6 warning signs for Molecular Templates (2 are a bit concerning!) that we have uncovered.
If you're unsure about the strength of Molecular Templates' business, why not explore our interactive list of stocks with solid business fundamentals for some other companies you may have missed.
New: Manage All Your Stock Portfolios in One Place
We've created the ultimate portfolio companion for stock investors, and it's free.
• Connect an unlimited number of Portfolios and see your total in one currency
• Be alerted to new Warning Signs or Risks via email or mobile
• Track the Fair Value of your stocks
Have feedback on this article? Concerned about the content? Get in touch with us directly. Alternatively, email editorial-team (at) simplywallst.com.
This article by Simply Wall St is general in nature. We provide commentary based on historical data and analyst forecasts only using an unbiased methodology and our articles are not intended to be financial advice. It does not constitute a recommendation to buy or sell any stock, and does not take account of your objectives, or your financial situation. We aim to bring you long-term focused analysis driven by fundamental data. Note that our analysis may not factor in the latest price-sensitive company announcements or qualitative material. Simply Wall St has no position in any stocks mentioned.
About OTCPK:MTEM.Q
Molecular Templates
A clinical stage biopharmaceutical company, focuses on the discovery and development of biologic therapeutics for the treatment of cancer and other serious diseases in the United States.
Adequate balance sheet low.
Market Insights

Advertisement
Community Narratives
MicroVision will explode future revenue by 380.37% with a vision towards success
Fair Value US$60.00|98.5% undervalued
TH
Community Contributor
The Indispensable Artery for a New North American Economy
Fair Value CA$132.87|2.3% undervalued
TI
Community Contributor