- United States
- /
- Biotech
- /
- NasdaqGS:MDGL
Calculating The Intrinsic Value Of Madrigal Pharmaceuticals, Inc. (NASDAQ:MDGL)


In this article we are going to estimate the intrinsic value of Madrigal Pharmaceuticals, Inc. (NASDAQ:MDGL) by projecting its future cash flows and then discounting them to today's value. We will take advantage of the Discounted Cash Flow (DCF) model for this purpose. Believe it or not, it's not too difficult to follow, as you'll see from our example!
We generally believe that a company's value is the present value of all of the cash it will generate in the future. However, a DCF is just one valuation metric among many, and it is not without flaws. If you want to learn more about discounted cash flow, the rationale behind this calculation can be read in detail in the Simply Wall St analysis model.
See our latest analysis for Madrigal Pharmaceuticals
Is Madrigal Pharmaceuticals Fairly Valued?
We are going to use a two-stage DCF model, which, as the name states, takes into account two stages of growth. The first stage is generally a higher growth period which levels off heading towards the terminal value, captured in the second 'steady growth' period. To start off with, we need to estimate the next ten years of cash flows. Where possible we use analyst estimates, but when these aren't available we extrapolate the previous free cash flow (FCF) from the last estimate or reported value. We assume companies with shrinking free cash flow will slow their rate of shrinkage, and that companies with growing free cash flow will see their growth rate slow, over this period. We do this to reflect that growth tends to slow more in the early years than it does in later years.
A DCF is all about the idea that a dollar in the future is less valuable than a dollar today, so we need to discount the sum of these future cash flows to arrive at a present value estimate:
10-year free cash flow (FCF) forecast
| 2023 | 2024 | 2025 | 2026 | 2027 | 2028 | 2029 | 2030 | 2031 | 2032 | |
| Levered FCF ($, Millions) | -US$292.7m | -US$241.4m | -US$115.2m | US$80.8m | US$119.9m | US$161.2m | US$201.1m | US$237.1m | US$268.2m | US$294.5m |
| Growth Rate Estimate Source | Analyst x3 | Analyst x3 | Analyst x3 | Analyst x3 | Est @ 48.39% | Est @ 34.47% | Est @ 24.72% | Est @ 17.90% | Est @ 13.12% | Est @ 9.78% |
| Present Value ($, Millions) Discounted @ 6.6% | -US$275 | -US$212 | -US$95.1 | US$62.6 | US$87.2 | US$110 | US$129 | US$142 | US$151 | US$156 |
("Est" = FCF growth rate estimated by Simply Wall St)
Present Value of 10-year Cash Flow (PVCF) = US$255m
The second stage is also known as Terminal Value, this is the business's cash flow after the first stage. The Gordon Growth formula is used to calculate Terminal Value at a future annual growth rate equal to the 5-year average of the 10-year government bond yield of 2.0%. We discount the terminal cash flows to today's value at a cost of equity of 6.6%.
Terminal Value (TV)= FCF2032 × (1 + g) ÷ (r – g) = US$294m× (1 + 2.0%) ÷ (6.6%– 2.0%) = US$6.5b
Present Value of Terminal Value (PVTV)= TV / (1 + r)10= US$6.5b÷ ( 1 + 6.6%)10= US$3.4b
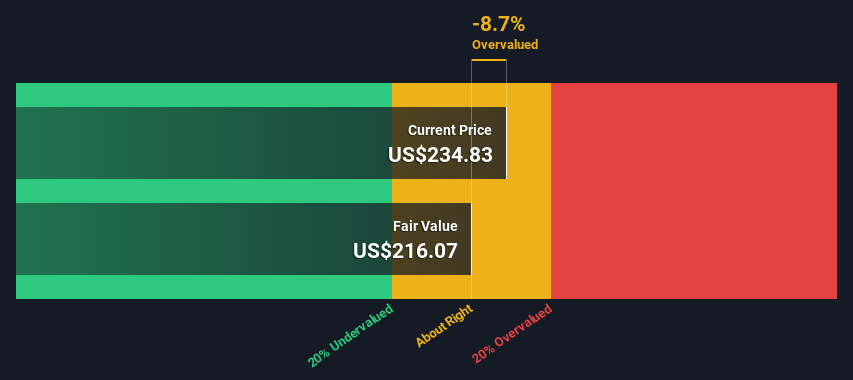
The total value, or equity value, is then the sum of the present value of the future cash flows, which in this case is US$3.7b. In the final step we divide the equity value by the number of shares outstanding. Relative to the current share price of US$235, the company appears around fair value at the time of writing. Valuations are imprecise instruments though, rather like a telescope - move a few degrees and end up in a different galaxy. Do keep this in mind.
The Assumptions
We would point out that the most important inputs to a discounted cash flow are the discount rate and of course the actual cash flows. Part of investing is coming up with your own evaluation of a company's future performance, so try the calculation yourself and check your own assumptions. The DCF also does not consider the possible cyclicality of an industry, or a company's future capital requirements, so it does not give a full picture of a company's potential performance. Given that we are looking at Madrigal Pharmaceuticals as potential shareholders, the cost of equity is used as the discount rate, rather than the cost of capital (or weighted average cost of capital, WACC) which accounts for debt. In this calculation we've used 6.6%, which is based on a levered beta of 0.828. Beta is a measure of a stock's volatility, compared to the market as a whole. We get our beta from the industry average beta of globally comparable companies, with an imposed limit between 0.8 and 2.0, which is a reasonable range for a stable business.
SWOT Analysis for Madrigal Pharmaceuticals
- Debt is well covered by earnings.
- Current share price is above our estimate of fair value.
- MDGL's financial characteristics indicate limited near-term opportunities for shareholders.
- Debt is not well covered by operating cash flow.
- Has less than 3 years of cash runway based on current free cash flow.
- Not expected to become profitable over the next 3 years.
Next Steps:
Whilst important, the DCF calculation ideally won't be the sole piece of analysis you scrutinize for a company. DCF models are not the be-all and end-all of investment valuation. Preferably you'd apply different cases and assumptions and see how they would impact the company's valuation. If a company grows at a different rate, or if its cost of equity or risk free rate changes sharply, the output can look very different. For Madrigal Pharmaceuticals, we've put together three pertinent factors you should explore:
- Risks: Consider for instance, the ever-present spectre of investment risk. We've identified 4 warning signs with Madrigal Pharmaceuticals (at least 3 which can't be ignored) , and understanding them should be part of your investment process.
- Future Earnings: How does MDGL's growth rate compare to its peers and the wider market? Dig deeper into the analyst consensus number for the upcoming years by interacting with our free analyst growth expectation chart.
- Other High Quality Alternatives: Do you like a good all-rounder? Explore our interactive list of high quality stocks to get an idea of what else is out there you may be missing!
PS. The Simply Wall St app conducts a discounted cash flow valuation for every stock on the NASDAQGS every day. If you want to find the calculation for other stocks just search here.
New: Manage All Your Stock Portfolios in One Place
We've created the ultimate portfolio companion for stock investors, and it's free.
• Connect an unlimited number of Portfolios and see your total in one currency
• Be alerted to new Warning Signs or Risks via email or mobile
• Track the Fair Value of your stocks
Have feedback on this article? Concerned about the content? Get in touch with us directly. Alternatively, email editorial-team (at) simplywallst.com.
This article by Simply Wall St is general in nature. We provide commentary based on historical data and analyst forecasts only using an unbiased methodology and our articles are not intended to be financial advice. It does not constitute a recommendation to buy or sell any stock, and does not take account of your objectives, or your financial situation. We aim to bring you long-term focused analysis driven by fundamental data. Note that our analysis may not factor in the latest price-sensitive company announcements or qualitative material. Simply Wall St has no position in any stocks mentioned.
About NasdaqGS:MDGL
Madrigal Pharmaceuticals
A clinical-stage biopharmaceutical company, focuses on the development of therapeutics for the treatment of non-alcoholic steatohepatitis (NASH) in the United States.
High growth potential with adequate balance sheet.

