Stock Analysis
- United States
- /
- Biotech
- /
- NasdaqCM:FRLN
Calculating The Intrinsic Value Of Freeline Therapeutics Holdings plc (NASDAQ:FRLN)


Key Insights
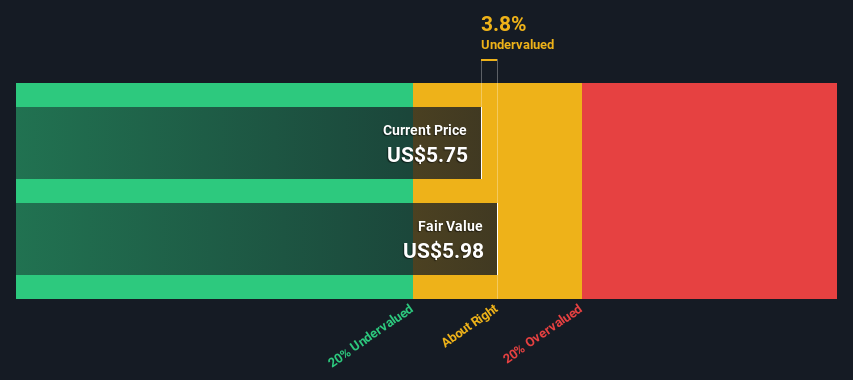
- Freeline Therapeutics Holdings' estimated fair value is US$5.98 based on Dividend Discount Model
- With US$5.75 share price, Freeline Therapeutics Holdings appears to be trading close to its estimated fair value
- Our fair value estimate is similar to Freeline Therapeutics Holdings' analyst price target of US$6.00
Today we'll do a simple run through of a valuation method used to estimate the attractiveness of Freeline Therapeutics Holdings plc (NASDAQ:FRLN) as an investment opportunity by taking the expected future cash flows and discounting them to their present value. The Discounted Cash Flow (DCF) model is the tool we will apply to do this. There's really not all that much to it, even though it might appear quite complex.
Remember though, that there are many ways to estimate a company's value, and a DCF is just one method. If you still have some burning questions about this type of valuation, take a look at the Simply Wall St analysis model.
Check out our latest analysis for Freeline Therapeutics Holdings
Step By Step Through The Calculation
As Freeline Therapeutics Holdings operates in the biotechs sector, we need to calculate the intrinsic value slightly differently. In this approach dividends per share (DPS) are used, as free cash flow is difficult to estimate and often not reported by analysts. Unless a company pays out the majority of its FCF as a dividend, this method will typically underestimate the value of the stock. We use the Gordon Growth Model, which assumes dividend will grow into perpetuity at a rate that can be sustained. For a number of reasons a very conservative growth rate is used that cannot exceed that of a company's Gross Domestic Product (GDP). In this case we used the 5-year average of the 10-year government bond yield (2.1%). The expected dividend per share is then discounted to today's value at a cost of equity of 7.7%. Relative to the current share price of US$5.8, the company appears about fair value at a 3.8% discount to where the stock price trades currently. Remember though, that this is just an approximate valuation, and like any complex formula - garbage in, garbage out.
Value Per Share = Expected Dividend Per Share / (Discount Rate - Perpetual Growth Rate)
= US$0.3 / (7.7% – 2.1%)
= US$6.0
The Assumptions
We would point out that the most important inputs to a discounted cash flow are the discount rate and of course the actual cash flows. You don't have to agree with these inputs, I recommend redoing the calculations yourself and playing with them. The DCF also does not consider the possible cyclicality of an industry, or a company's future capital requirements, so it does not give a full picture of a company's potential performance. Given that we are looking at Freeline Therapeutics Holdings as potential shareholders, the cost of equity is used as the discount rate, rather than the cost of capital (or weighted average cost of capital, WACC) which accounts for debt. In this calculation we've used 7.7%, which is based on a levered beta of 0.800. Beta is a measure of a stock's volatility, compared to the market as a whole. We get our beta from the industry average beta of globally comparable companies, with an imposed limit between 0.8 and 2.0, which is a reasonable range for a stable business.
SWOT Analysis for Freeline Therapeutics Holdings
- Currently debt free.
- Shareholders have been diluted in the past year.
- Forecast to reduce losses next year.
- Current share price is below our estimate of fair value.
- Has less than 3 years of cash runway based on current free cash flow.
- Not expected to become profitable over the next 3 years.
Moving On:
Whilst important, the DCF calculation is only one of many factors that you need to assess for a company. It's not possible to obtain a foolproof valuation with a DCF model. Rather it should be seen as a guide to "what assumptions need to be true for this stock to be under/overvalued?" For instance, if the terminal value growth rate is adjusted slightly, it can dramatically alter the overall result. For Freeline Therapeutics Holdings, we've compiled three important items you should look at:
- Risks: To that end, you should learn about the 6 warning signs we've spotted with Freeline Therapeutics Holdings (including 3 which are significant) .
- Future Earnings: How does FRLN's growth rate compare to its peers and the wider market? Dig deeper into the analyst consensus number for the upcoming years by interacting with our free analyst growth expectation chart.
- Other High Quality Alternatives: Do you like a good all-rounder? Explore our interactive list of high quality stocks to get an idea of what else is out there you may be missing!
PS. The Simply Wall St app conducts a discounted cash flow valuation for every stock on the NASDAQCM every day. If you want to find the calculation for other stocks just search here.
Valuation is complex, but we're helping make it simple.
Find out whether Freeline Therapeutics Holdings is potentially over or undervalued by checking out our comprehensive analysis, which includes fair value estimates, risks and warnings, dividends, insider transactions and financial health.
View the Free AnalysisHave feedback on this article? Concerned about the content? Get in touch with us directly. Alternatively, email editorial-team (at) simplywallst.com.
This article by Simply Wall St is general in nature. We provide commentary based on historical data and analyst forecasts only using an unbiased methodology and our articles are not intended to be financial advice. It does not constitute a recommendation to buy or sell any stock, and does not take account of your objectives, or your financial situation. We aim to bring you long-term focused analysis driven by fundamental data. Note that our analysis may not factor in the latest price-sensitive company announcements or qualitative material. Simply Wall St has no position in any stocks mentioned.
About NasdaqCM:FRLN
Freeline Therapeutics Holdings
Freeline Therapeutics Holdings plc, a clinical-stage biotechnology company, develops transformative adeno-associated virus (AAV) vector-mediated gene therapies.
High growth potential with adequate balance sheet.
