Stock Analysis
- United States
- /
- Biotech
- /
- NasdaqCM:CGEN
Further weakness as Compugen (NASDAQ:CGEN) drops 15% this week, taking three-year losses to 79%


Every investor on earth makes bad calls sometimes. But really big losses can really drag down an overall portfolio. So take a moment to sympathize with the long term shareholders of Compugen Ltd. (NASDAQ:CGEN), who have seen the share price tank a massive 79% over a three year period. That'd be enough to cause even the strongest minds some disquiet. Shareholders have had an even rougher run lately, with the share price down 35% in the last 90 days.
After losing 15% this past week, it's worth investigating the company's fundamentals to see what we can infer from past performance.
See our latest analysis for Compugen
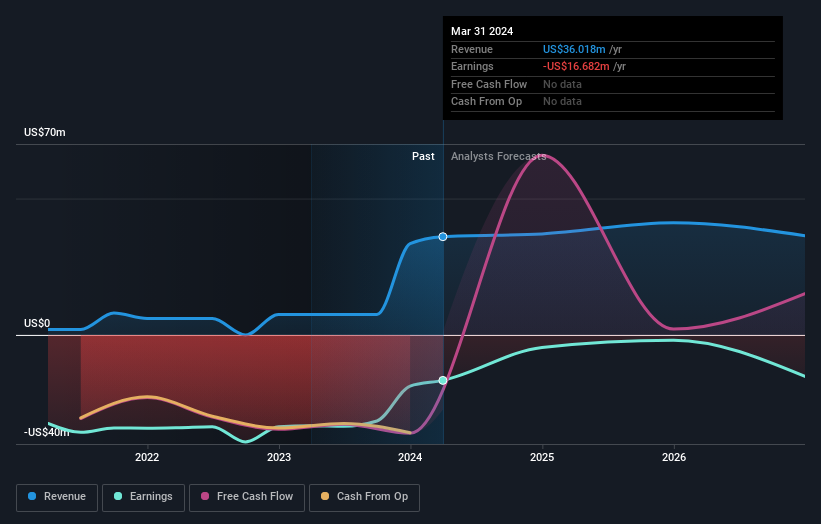
Given that Compugen didn't make a profit in the last twelve months, we'll focus on revenue growth to form a quick view of its business development. When a company doesn't make profits, we'd generally hope to see good revenue growth. As you can imagine, fast revenue growth, when maintained, often leads to fast profit growth.
In the last three years, Compugen saw its revenue grow by 81% per year, compound. That's well above most other pre-profit companies. So on the face of it we're really surprised to see the share price down 21% a year in the same time period. You'd want to take a close look at the balance sheet, as well as the losses. Ultimately, revenue growth doesn't amount to much if the business can't scale well. Unless the balance sheet is strong, the company might have to raise capital.
The company's revenue and earnings (over time) are depicted in the image below (click to see the exact numbers).
Balance sheet strength is crucial. It might be well worthwhile taking a look at our free report on how its financial position has changed over time.
A Different Perspective
It's nice to see that Compugen shareholders have received a total shareholder return of 47% over the last year. Notably the five-year annualised TSR loss of 9% per year compares very unfavourably with the recent share price performance. The long term loss makes us cautious, but the short term TSR gain certainly hints at a brighter future. It's always interesting to track share price performance over the longer term. But to understand Compugen better, we need to consider many other factors. Case in point: We've spotted 4 warning signs for Compugen you should be aware of, and 1 of them makes us a bit uncomfortable.
If you would prefer to check out another company -- one with potentially superior financials -- then do not miss this free list of companies that have proven they can grow earnings.
Please note, the market returns quoted in this article reflect the market weighted average returns of stocks that currently trade on American exchanges.
Valuation is complex, but we're helping make it simple.
Find out whether Compugen is potentially over or undervalued by checking out our comprehensive analysis, which includes fair value estimates, risks and warnings, dividends, insider transactions and financial health.
View the Free AnalysisHave feedback on this article? Concerned about the content? Get in touch with us directly. Alternatively, email editorial-team (at) simplywallst.com.
This article by Simply Wall St is general in nature. We provide commentary based on historical data and analyst forecasts only using an unbiased methodology and our articles are not intended to be financial advice. It does not constitute a recommendation to buy or sell any stock, and does not take account of your objectives, or your financial situation. We aim to bring you long-term focused analysis driven by fundamental data. Note that our analysis may not factor in the latest price-sensitive company announcements or qualitative material. Simply Wall St has no position in any stocks mentioned.
Valuation is complex, but we're helping make it simple.
Find out whether Compugen is potentially over or undervalued by checking out our comprehensive analysis, which includes fair value estimates, risks and warnings, dividends, insider transactions and financial health.
View the Free AnalysisHave feedback on this article? Concerned about the content? Get in touch with us directly. Alternatively, email editorial-team@simplywallst.com
About NasdaqCM:CGEN
Compugen
A clinical-stage therapeutic discovery and development company, researches, develops, and commercializes therapeutic and product candidates in Israel, the United States, and Europe.
Undervalued with excellent balance sheet.
