Advertisement
- United States
- /
- Biotech
- /
- NasdaqGS:ARQT
Is Arcutis Biotherapeutics Fairly Priced After a 102.5% Rally and FDA Approvals?

Simply Wall St
Reviewed by Bailey Pemberton
- Wondering whether Arcutis Biotherapeutics could be hiding untapped value or flying too close to the sun? Let’s dig into what savvy investors are noticing about this biotech stock lately.
- This year alone, Arcutis shares have surged an impressive 102.5%, with a 48.9% jump over the past month and a remarkable 18.0% gain in just the last week.
- Much of this momentum follows fresh updates around the company’s dermatology drug pipeline and FDA approvals for new treatments, sparking renewed optimism among investors. Media coverage has also highlighted strategic partnerships and expanding market reach, giving extra fuel to the recent rally.
- But does all this excitement actually translate to fair value? With Arcutis scoring 3 out of 6 on our valuation checks, we’ll break down what that really means for investors using different methods, and reveal a smarter way to look at value by the end of this article.
Approach 1: Arcutis Biotherapeutics Discounted Cash Flow (DCF) Analysis
A Discounted Cash Flow (DCF) model estimates a company's value by projecting its future cash flows and discounting them back to today's dollars. For Arcutis Biotherapeutics, the DCF approach helps clarify whether the market is currently overestimating or underestimating its future growth.
Right now, Arcutis reports a Free Cash Flow (FCF) of -$45.4 Million, reflecting current investments and the costs of expansion. Looking ahead, analyst consensus suggests a sharp turnaround with FCF expected to rise each year, reaching $295.5 Million by 2029. While analysts offer estimates for the next five years, any projections beyond that are extrapolations based on historical growth and sector trends.
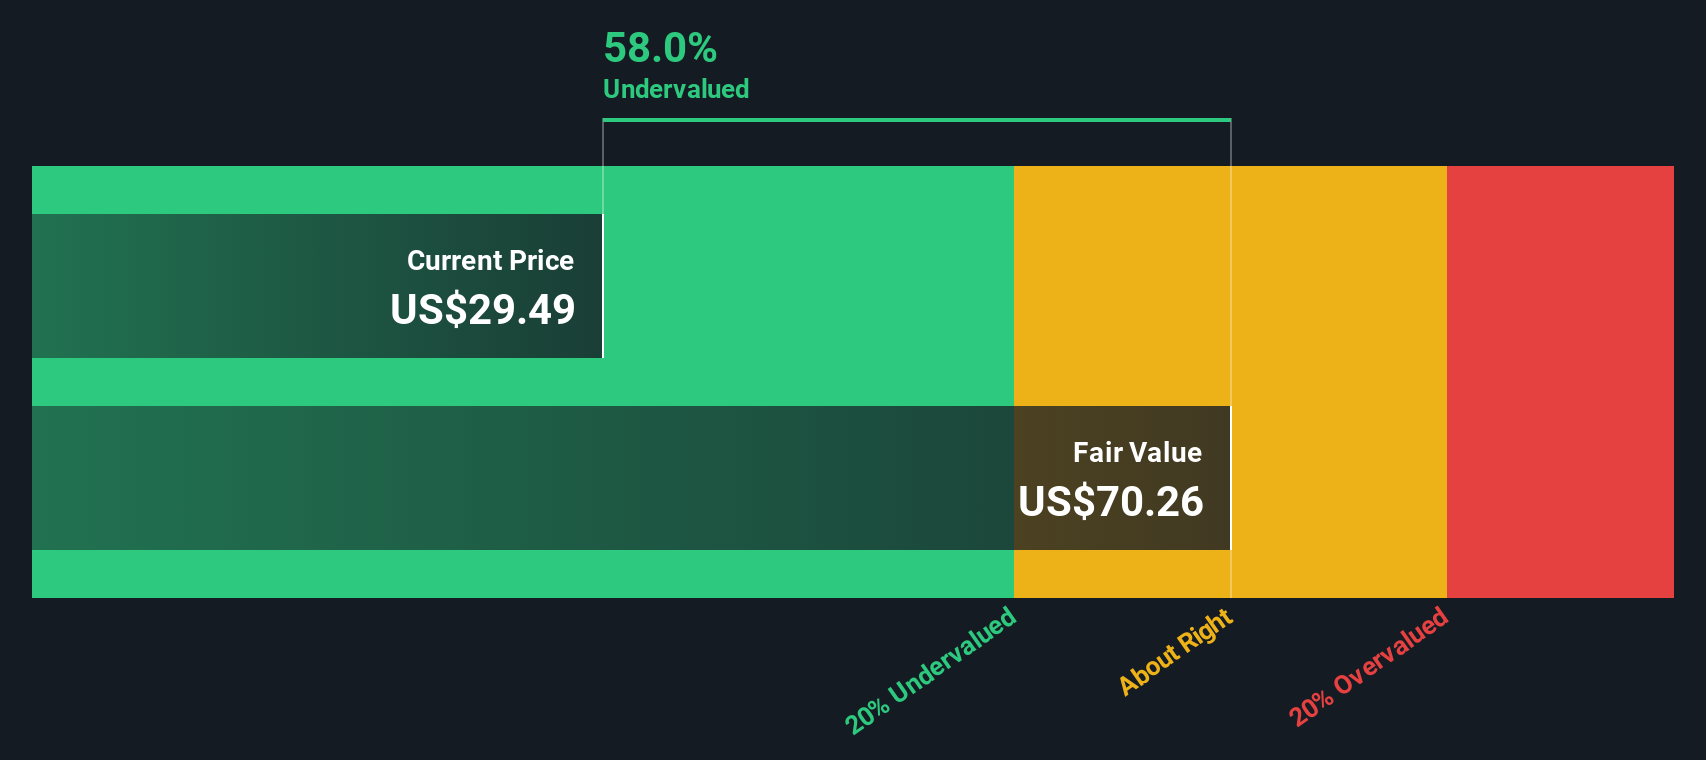
The DCF model crunches these numbers by factoring in the steady climb of FCF and discounting future dollars to their present worth to arrive at an intrinsic value of $70.26 per share. Compared to where Arcutis trades today, this points to the stock being 58.0% undervalued.
Result: UNDERVALUED
Our Discounted Cash Flow (DCF) analysis suggests Arcutis Biotherapeutics is undervalued by 58.0%. Track this in your watchlist or portfolio, or discover 917 more undervalued stocks based on cash flows.
Approach 2: Arcutis Biotherapeutics Price vs Sales (P/S)
Price-to-Sales (P/S) is often the preferred valuation method for biotech companies like Arcutis Biotherapeutics, especially when profits are still on the horizon but revenue growth is accelerating. For companies with uncertain or negative earnings, as is common during development phases, P/S offers a clear view of how the market values each dollar of sales.
Investors should remember that growth expectations and perceived risk have a big influence on what counts as a "normal" or "fair" P/S multiple. High-growth companies typically command higher multiples, since investors anticipate future revenues and profits.
Currently, Arcutis trades at a P/S ratio of 11.36x. That is just under the Biotechs industry average of 11.59x and higher than its peer group’s average of 7.63x. However, raw comparisons only tell part of the story.
Simply Wall St’s proprietary “Fair Ratio” is 10.42x for Arcutis. Unlike industry or peer averages, this metric provides a tailored benchmark, considering factors like Arcutis’s expected sales growth, profit margins, market capitalization, and overall risk profile. The Fair Ratio recognizes that a company with promising pipeline drugs or stronger growth potential may justify a higher multiple, while greater risks may call for a discount.
Comparing Arcutis’s current P/S multiple with its Fair Ratio, we see that the stock is trading just about where it should be, suggesting the market is appropriately pricing its prospects given current fundamentals and expectations.
Result: ABOUT RIGHT

PS ratios tell one story, but what if the real opportunity lies elsewhere? Discover 1422 companies where insiders are betting big on explosive growth.
Upgrade Your Decision Making: Choose your Arcutis Biotherapeutics Narrative
Earlier, we mentioned there is an even better way to understand valuation, so let's introduce you to Narratives. A Narrative is your own unique investing story, where you connect what you believe about a company’s future, such as potential growth, risks, and competitive edge, to your financial forecasts and fair value estimate. Instead of just relying on numbers, Narratives let you explain your assumptions, for example about future revenue or margins, and see how your story stacks up through a dynamic, continually updated fair value.
Available in the Simply Wall St Community, Narratives are easy tools used by millions of investors to set their view on when to buy or sell by comparing a continually refreshed Fair Value with today's share price. Whenever the company posts new results or news emerges, all linked Narratives are updated automatically so your outlook always reflects the latest developments.
For Arcutis Biotherapeutics, one Narrative projects rapid sales growth and large market adoption, assigning a fair value of $40 per share. Another sees ongoing challenges and tougher competition, yielding a much more conservative fair value of $19 per share. This range shows how Narratives capture different perspectives, allowing you to confidently align your investment decisions with your own, evolving view of the business.
Do you think there's more to the story for Arcutis Biotherapeutics? Head over to our Community to see what others are saying!

This article by Simply Wall St is general in nature. We provide commentary based on historical data and analyst forecasts only using an unbiased methodology and our articles are not intended to be financial advice. It does not constitute a recommendation to buy or sell any stock, and does not take account of your objectives, or your financial situation. We aim to bring you long-term focused analysis driven by fundamental data. Note that our analysis may not factor in the latest price-sensitive company announcements or qualitative material. Simply Wall St has no position in any stocks mentioned.
New: Manage All Your Stock Portfolios in One Place
We've created the ultimate portfolio companion for stock investors, and it's free.
• Connect an unlimited number of Portfolios and see your total in one currency
• Be alerted to new Warning Signs or Risks via email or mobile
• Track the Fair Value of your stocks
Have feedback on this article? Concerned about the content? Get in touch with us directly. Alternatively, email editorial-team@simplywallst.com
About NasdaqGS:ARQT
Arcutis Biotherapeutics
A biopharmaceutical company, focuses on developing and commercializing treatments for dermatological diseases.
Exceptional growth potential with adequate balance sheet.
Similar Companies
Market Insights

Advertisement
Community Narratives
MicroVision will explode future revenue by 380.37% with a vision towards success
Fair Value US$60.00|98.4% undervalued
TH
Community Contributor
The Indispensable Artery for a New North American Economy
Fair Value CA$132.87|1.3% undervalued
TI
Community Contributor