Advertisement
- United States
- /
- Biotech
- /
- NasdaqGS:ANAB
AnaptysBio (ANAB) Losses Worsen 29.9% Annually, Undercutting Bullish Revenue Growth Narratives

Simply Wall St
Reviewed by Simply Wall St
AnaptysBio (ANAB) is forecasting revenue growth of 25.9% per year, ahead of the broader US market’s 10.5% growth rate. Despite this, the company remains unprofitable, with losses climbing at an annual pace of 29.9% over the past five years. Net profit margins and earnings quality have yet to show improvement. Shares currently trade at a Price-to-Sales ratio of 8.2x, which offers better value than the US Biotech sector average of 10.3x, but appears expensive relative to peers at 5.8x. This reflects optimism for revenue growth, balanced against ongoing unprofitability.
See our full analysis for AnaptysBio.Next, we break down how these results compare to the dominant narratives, highlighting areas where the numbers align with or diverge from what the market expects.
Curious how numbers become stories that shape markets? Explore Community Narratives
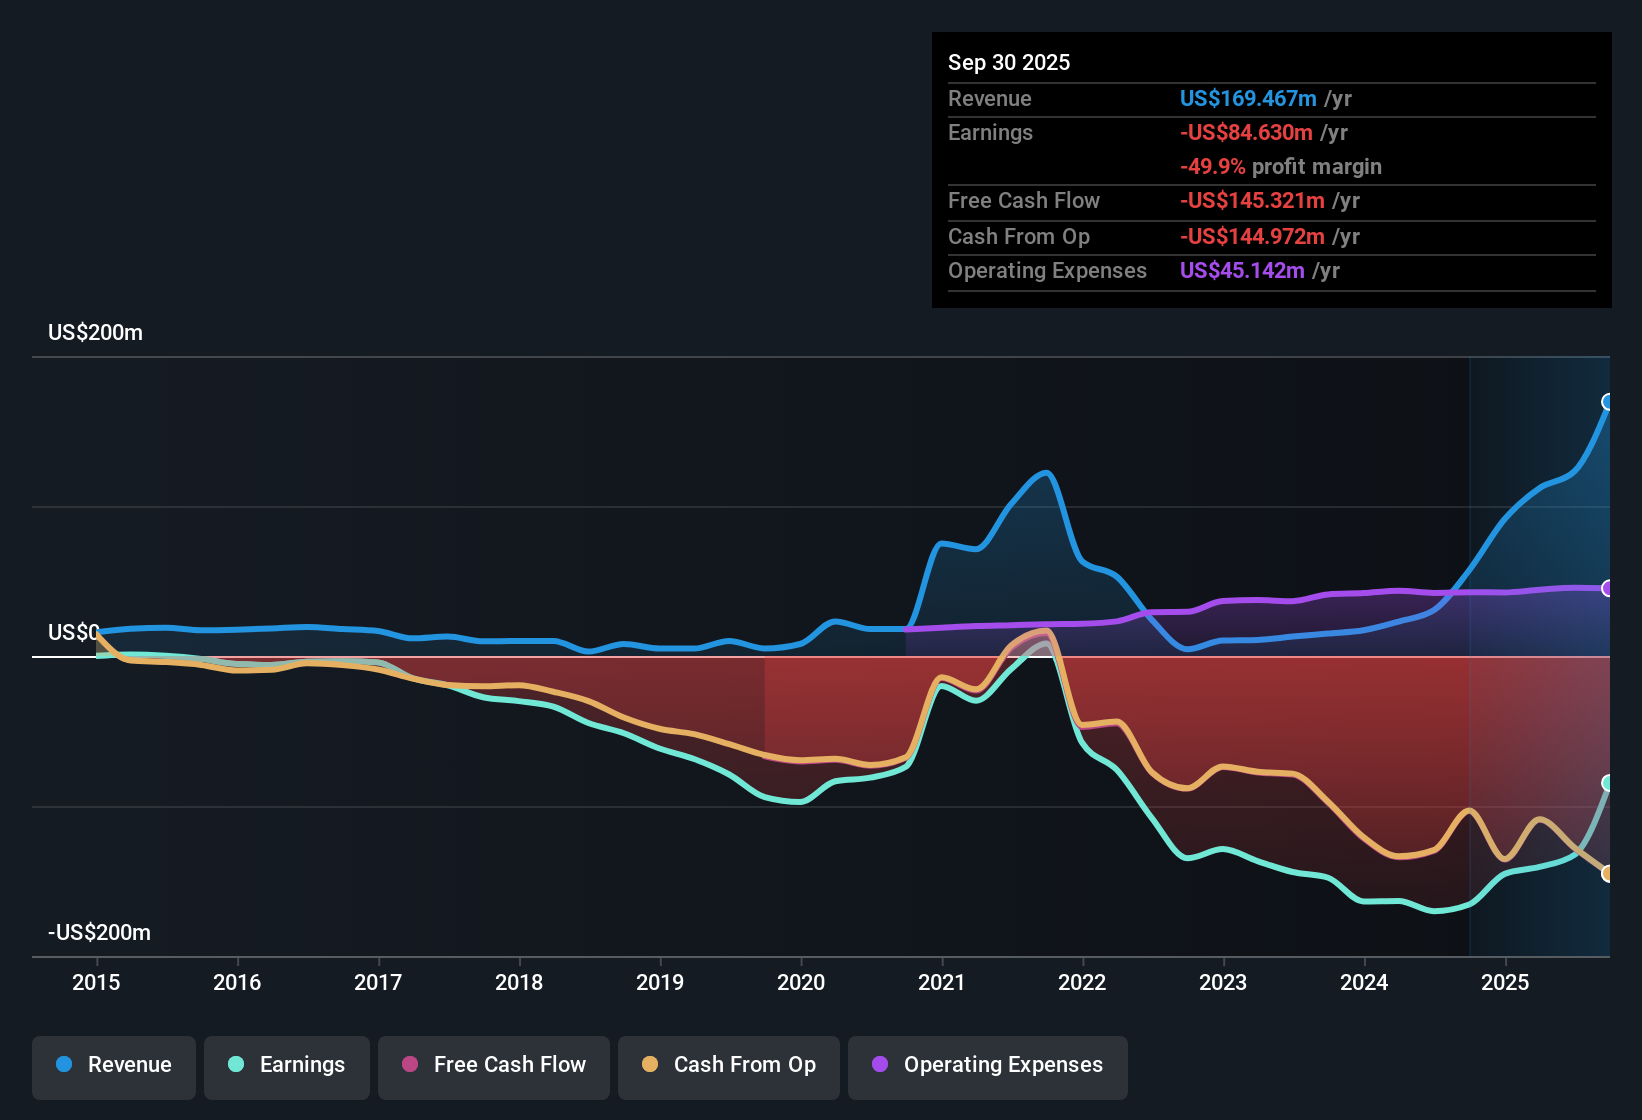
Losses Have Grown 29.9% Per Year
- AnaptysBio's net losses have increased at an annual rate of 29.9% over the last five years, far outpacing its projected revenue growth and highlighting a widening gap between sales gains and profitable operations.
- Despite the strong expansion in top-line prospects, the prevailing market view notes that persistent, rapid loss growth—and no visible turn in margins or earnings quality—raises questions about when, or if, operational efficiency will finally catch up to revenue momentum.
- With earnings still negative and showing no signs of improvement, the path to profitability continues to look challenging even as the top line accelerates.
- Compared to peers, this persistent unprofitability means investor optimism remains highly sensitive to any progress in closing that loss gap.
Margins Show No Improvement Year on Year
- Over the past year, net profit margin and quality of earnings have remained unchanged, showing no concrete signs of operational turnarounds or cost leverage from revenue gains.
- Prevailing market analysis underlines that while revenue growth sparks hope, the complete absence of margin progress and no recent reduction in net losses heavily tempers confidence in a near-term turnaround.
- Analysts watching for expense controls or efficiency gains have not seen evidence of positive shifts in profit margin trends.
- Market sentiment is likely to remain cautious as long as both earnings quality and margins continue to stagnate despite ongoing topline momentum.
Valuation Sits Between Industry and Peers
- The company trades at a Price-to-Sales ratio of 8.2x, lower than the US Biotech industry average of 10.3x, but substantially higher than the direct peer group at 5.8x. This reflects mixed sentiment on risk versus growth potential.
- Prevailing market analysis points out this in-between valuation signals that the market is willing to pay up for potential revenue upside yet discounts the shares against the broader sector due to AnaptysBio’s ongoing losses and lack of profitability breakthroughs.
- This push and pull between optimism for growth and skepticism about losses means future share price appreciation will depend on tangible improvements in margins or earnings traction.
- As long as unprofitability persists, peer-relative valuation may act as a ceiling for further multiple expansion even if industry sentiment supports stronger names.
Next Steps
Don't just look at this quarter; the real story is in the long-term trend. We've done an in-depth analysis on AnaptysBio's growth and its valuation to see if today's price is a bargain. Add the company to your watchlist or portfolio now so you don't miss the next big move.
See What Else Is Out There
Despite promising revenue growth, AnaptysBio's ongoing losses and stagnant margins highlight persistent challenges in achieving profitability and efficient operations.
If you want consistency instead, use stable growth stocks screener (2073 results) to uncover companies that pair solid earnings with reliable, steady performance through different market conditions.
This article by Simply Wall St is general in nature. We provide commentary based on historical data and analyst forecasts only using an unbiased methodology and our articles are not intended to be financial advice. It does not constitute a recommendation to buy or sell any stock, and does not take account of your objectives, or your financial situation. We aim to bring you long-term focused analysis driven by fundamental data. Note that our analysis may not factor in the latest price-sensitive company announcements or qualitative material. Simply Wall St has no position in any stocks mentioned.
New: Manage All Your Stock Portfolios in One Place
We've created the ultimate portfolio companion for stock investors, and it's free.
• Connect an unlimited number of Portfolios and see your total in one currency
• Be alerted to new Warning Signs or Risks via email or mobile
• Track the Fair Value of your stocks
Have feedback on this article? Concerned about the content? Get in touch with us directly. Alternatively, email editorial-team@simplywallst.com
About NasdaqGS:ANAB
AnaptysBio
A clinical-stage biotechnology company, focuses in delivering immunology therapeutics.
Slight risk with limited growth.
Market Insights

Advertisement
Community Narratives
The company that turned a verb into a global necessity and basically runs the modern internet, digital ads, smartphones, maps, and AI.
Fair Value US$300.00|5.2% undervalued
OS
Community Contributor
Flowers Foods Pays A Fair Price For Health
Fair Value US$16.12|24.9% undervalued
NV
Community Contributor
TMX Group will thrive with 33.3% profit margin and enduring market moat
Fair Value CA$49.90|3.3% overvalued
LI
Community Contributor
The "Molecular Pencil": Why Beam's Technology is Built to Win
Fair Value US$65.01|64.5% undervalued
DA
Community Contributor