Advertisement
- United States
- /
- Biotech
- /
- NasdaqGS:ALNY
Alnylam Pharmaceuticals (ALNY) Profitability Milestone Reinforces Bull Case Ahead of Forecasted 52% Earnings Growth

Simply Wall St
Reviewed by Simply Wall St
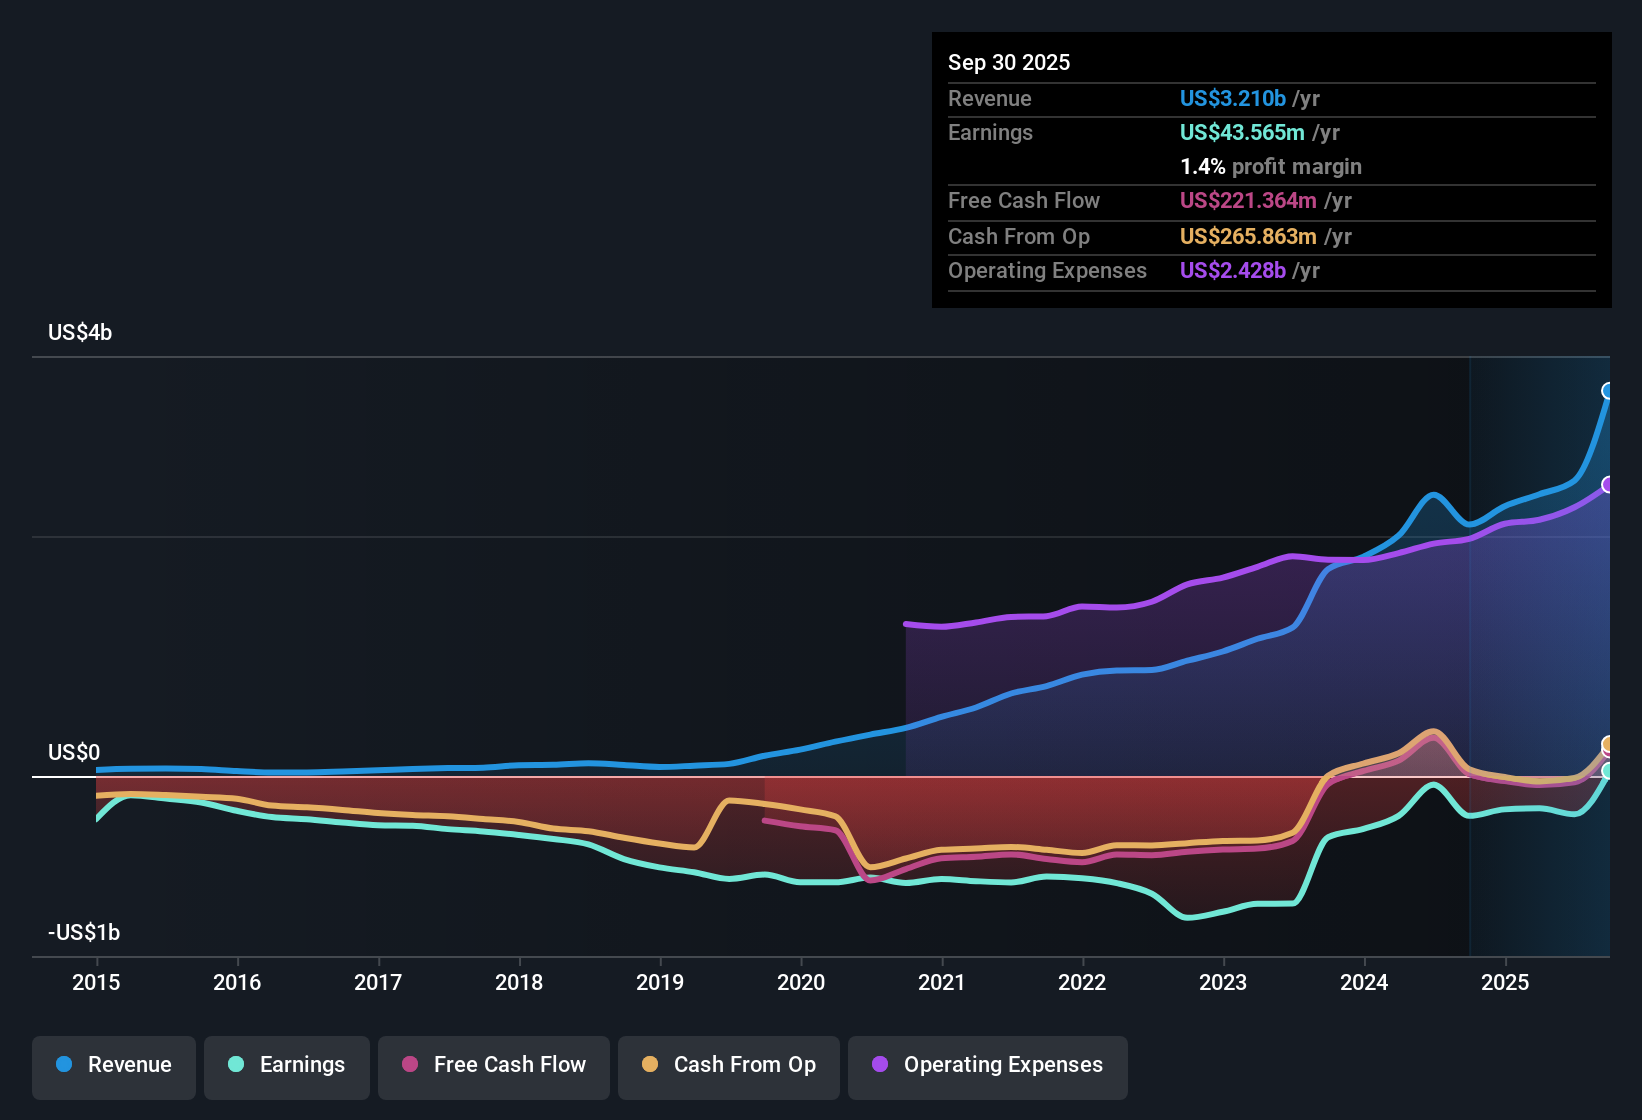
Alnylam Pharmaceuticals (ALNY) achieved profitability over the past year, with average annual earnings growth of 27.5% over the last five years. Looking ahead, forecasts anticipate earnings growth of 52% per year and revenue rising by 25.2% annually, both well ahead of US market benchmarks. With recently improved net profit margins, high-quality earnings, and a discounted cash flow valuation that suggests shares are trading below fair value, investors may see this as a compelling growth narrative, even as the price-to-sales ratio looks relatively high compared to peers.
See our full analysis for Alnylam Pharmaceuticals.The next step is to see how these robust numbers compare to the prevailing market narratives, where the latest results might feed the story or turn it on its head.
See what the community is saying about Alnylam Pharmaceuticals
Margins Widen as Royalty Costs Rise
- Gross margin fell from 84% to 79% year-over-year according to analyst forecasts, reflecting increased royalty costs from climbing AMVUTTRA sales. Net profit margin, however, improved with new profitability.
- Analysts' consensus view sees widening net profit margins as product revenue growth outpaces cost escalation.
- Critics highlight that higher 340B channel usage and Medicare Part D rebates could drive further gross-to-net reductions.
- These factors may limit near-term profit expansion despite robust top-line growth.
TTR Franchise Concentration Poses Risks
- Heavy reliance on the TTR franchise, especially AMVUTTRA, leaves revenue and earnings vulnerable if competition intensifies or commercialization stumbles.
- Analysts' consensus view acknowledges the strong adoption and global rollout of AMVUTTRA driving sustained double-digit revenue growth.
- The view also cautions that setbacks in launch trajectory or negative trial outcomes could have an outsized effect on overall performance.
- Revenue concentration risk may be amplified as diagnostics and disease awareness accelerate market expansion.
DCF Fair Value Versus Valuation Ratios
- Current share price stands at $456.13, below the DCF fair value of $788.35, but above the analyst consensus price target of $473.86. The price-to-sales ratio remains higher than both peer and industry averages.
- Analysts' consensus view observes that, while discounted cash flow suggests meaningful upside, the premium on relative valuation ratios may temper the case for multiple expansion.
- The consensus price target sits just 4% higher than the current share price, signaling little expected near-term re-rating.
- This reinforces the need to sense check analyst forecasts against personal conviction about revenue and earnings growth.
See how the consensus view shapes the narrative in detail: 📊 Read the full Alnylam Pharmaceuticals Consensus Narrative.
Next Steps
To see how these results tie into long-term growth, risks, and valuation, check out the full range of community narratives for Alnylam Pharmaceuticals on Simply Wall St. Add the company to your watchlist or portfolio so you'll be alerted when the story evolves.
Have another take on the figures? Put your perspective to work and shape a fresh analysis in just a few minutes: Do it your way.
A great starting point for your Alnylam Pharmaceuticals research is our analysis highlighting 3 key rewards and 1 important warning sign that could impact your investment decision.
See What Else Is Out There
Alnylam’s concentration in a single drug franchise and premium valuation ratios mean its growth prospects rely heavily on continued flawless execution.
If you prefer companies trading at more attractive prices relative to future cash flows, check out these 836 undervalued stocks based on cash flows for accessible opportunities that may offer better value right now.
This article by Simply Wall St is general in nature. We provide commentary based on historical data and analyst forecasts only using an unbiased methodology and our articles are not intended to be financial advice. It does not constitute a recommendation to buy or sell any stock, and does not take account of your objectives, or your financial situation. We aim to bring you long-term focused analysis driven by fundamental data. Note that our analysis may not factor in the latest price-sensitive company announcements or qualitative material. Simply Wall St has no position in any stocks mentioned.
New: Manage All Your Stock Portfolios in One Place
We've created the ultimate portfolio companion for stock investors, and it's free.
• Connect an unlimited number of Portfolios and see your total in one currency
• Be alerted to new Warning Signs or Risks via email or mobile
• Track the Fair Value of your stocks
Have feedback on this article? Concerned about the content? Get in touch with us directly. Alternatively, email editorial-team@simplywallst.com
About NasdaqGS:ALNY
Alnylam Pharmaceuticals
Alnylam Pharmaceuticals, Inc. discovers, develops, and commercializes therapeutics based on ribonucleic acid interference.
Exceptional growth potential with adequate balance sheet.
Similar Companies
Market Insights

Advertisement
Community Narratives
The company that turned a verb into a global necessity and basically runs the modern internet, digital ads, smartphones, maps, and AI.
Fair Value US$300.00|6.2% undervalued
OS
Community Contributor
Flowers Foods Pays A Fair Price For Health
Fair Value US$16.12|26.0% undervalued
NV
Community Contributor
TMX Group will thrive with 33.3% profit margin and enduring market moat
Fair Value CA$49.90|3.7% overvalued
LI
Community Contributor