Advertisement
- United States
- /
- Media
- /
- NYSE:MNTN
Should Investors Reevaluate MNTN After a 43.7% Year-to-Date Price Drop?

Simply Wall St
Reviewed by Bailey Pemberton
- Wondering if MNTN is a hidden value opportunity or if its recent price drops are a sign to stay away? You are not alone. We are diving straight in to help make sense of its current valuation.
- MNTN's stock price has been under significant pressure lately, falling 10.3% in the past week and dropping 17.4% over the last month. This has contributed to a steep year-to-date decline of 43.7%.
- These sharp moves have been catching the attention of investors and analysts. Several recent news stories highlight shifting market sentiment and speculation about MNTN’s long-term business strategy. Headlines have focused on management changes and industry-wide challenges that may have influenced the downturn, making it even more important to scrutinize the company’s valuation right now.
- Out of Simply Wall St's 6 valuation checks, MNTN scores just 2 for undervaluation. There is more to explore in terms of what drives this rating. Next, we will dig into various valuation methods and also show you an approach that goes beyond the usual checklists.
MNTN scores just 2/6 on our valuation checks. See what other red flags we found in the full valuation breakdown.
Approach 1: MNTN Discounted Cash Flow (DCF) Analysis
The Discounted Cash Flow (DCF) model estimates a company's value by projecting its future cash flows and discounting them to today's dollars. This approach helps investors gauge what MNTN may truly be worth, based on its expected ability to generate cash for shareholders over time.
MNTN's latest reported Free Cash Flow stands at $46.7 million. Analysts project substantial growth, with Free Cash Flow expected to reach $132.5 million by 2029. The first five years of forecasts are based on analyst consensus, while the estimates beyond that are an extrapolation provided by Simply Wall St. These projections reflect both optimism about MNTN's turnaround potential and the uncertainty of longer-range estimates.
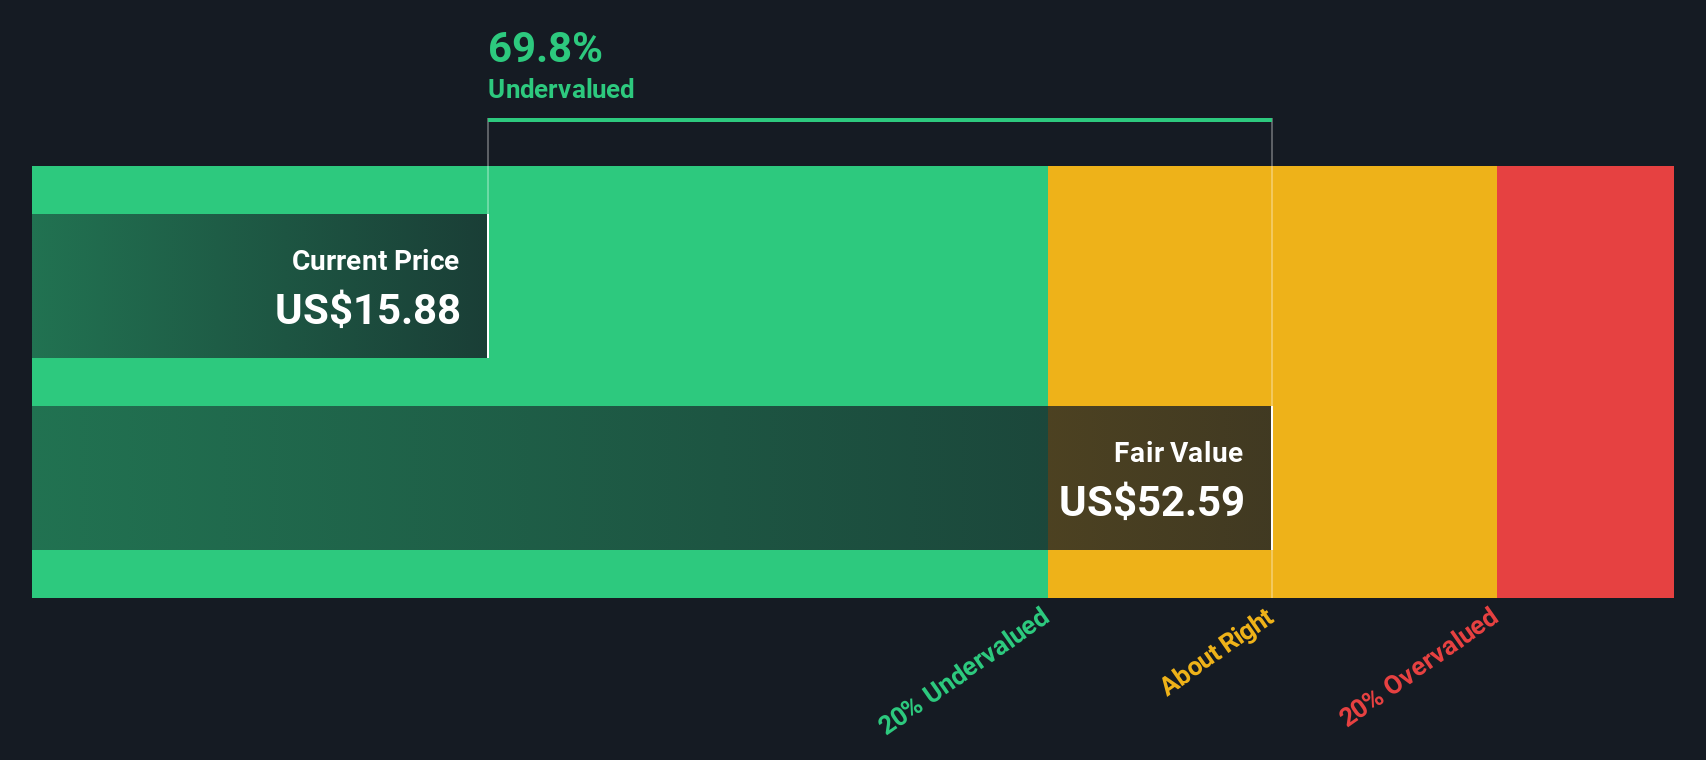
According to this two-stage Free Cash Flow to Equity model, MNTN's intrinsic value is calculated at $52.59 per share. This implies the stock trades at a steep 71.8% discount to its estimated fair value right now.
In summary, the DCF approach signals significant upside for MNTN at present levels.
Result: UNDERVALUED
Our Discounted Cash Flow (DCF) analysis suggests MNTN is undervalued by 71.8%. Track this in your watchlist or portfolio, or discover 840 more undervalued stocks based on cash flows.
Approach 2: MNTN Price vs Sales
The Price-to-Sales (P/S) ratio is often used as a valuation metric for companies that are not yet consistently profitable but still generate meaningful revenue. This makes it a reasonable way to compare MNTN to its peers and industry, since MNTN has negative earnings but a sizable top line. The P/S ratio focuses on the value investors are placing on each dollar of a company's sales, which can be especially insightful during periods when profit margins are thin.
Growth expectations and risk profiles are critical when judging what a fair P/S ratio should be. Companies with stronger sales growth or lower risk profiles are generally awarded a premium multiple by the market, while slower-growing or riskier businesses tend to trade at a discount. With this in mind, we can assess whether MNTN’s valuation is justified.
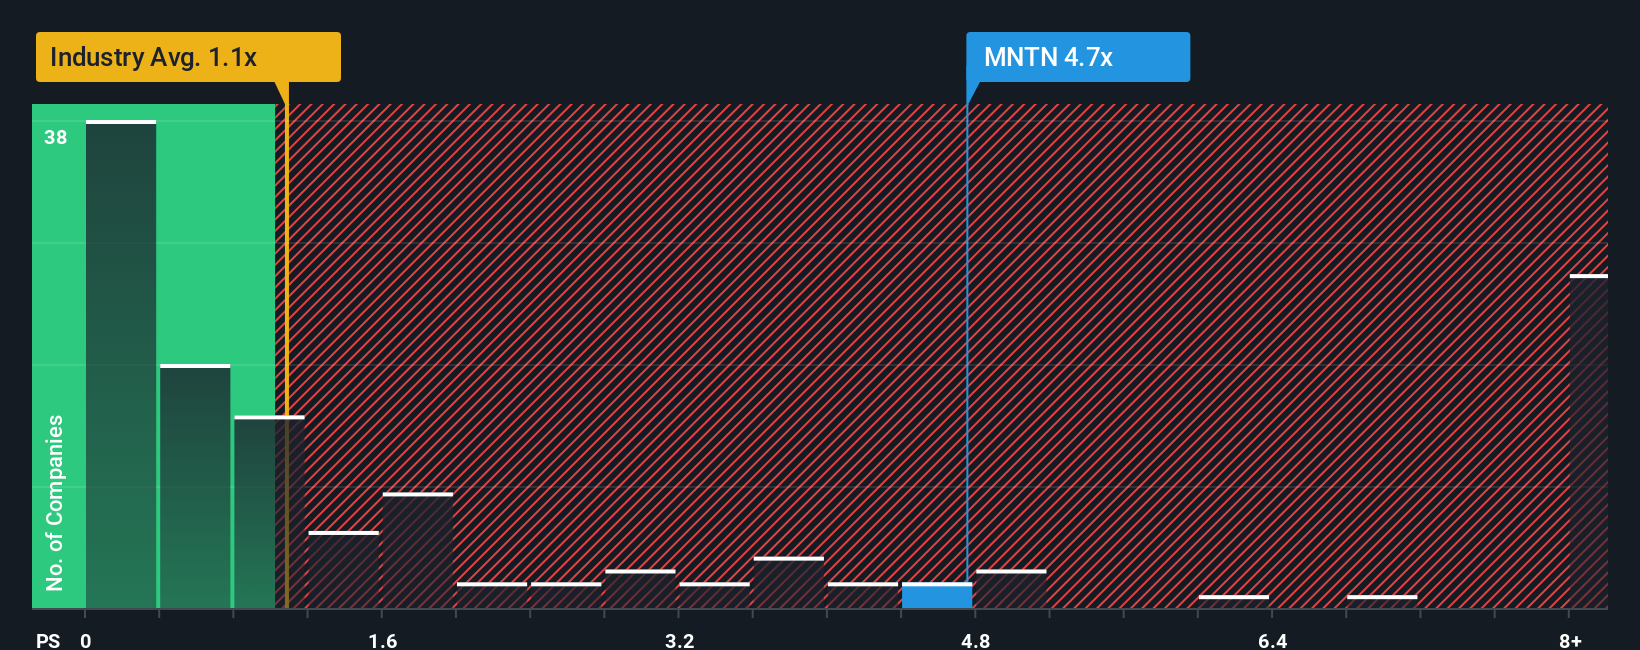
MNTN currently trades at a P/S ratio of 4.15x, significantly above both its Media industry average of 1.02x and its peer group at 0.99x. However, simple comparisons can be misleading, so Simply Wall St calculates a proprietary "Fair Ratio," which is a preferred multiple that blends in factors like growth rates, profit margins, market cap, risks and the company’s place within its industry. This customized approach tends to be more robust than merely benchmarking against industry averages or peers, as it captures unique features about MNTN’s business and prospects.
For MNTN, the actual P/S ratio of 4.15x is considerably higher than the Fair Ratio generated by Simply Wall St’s model. This suggests that, based on these factors, MNTN is currently trading above what would typically be justified for its profile.
Result: OVERVALUED
PS ratios tell one story, but what if the real opportunity lies elsewhere? Discover 1411 companies where insiders are betting big on explosive growth.
Upgrade Your Decision Making: Choose your MNTN Narrative
Earlier we mentioned that there is an even better way to understand valuation, so let's introduce you to Narratives. A Narrative is your personal story or perspective on a company like MNTN, where you link the facts and numbers to your own expectations of future revenue, profits and value. This approach goes beyond rigid checklists. It lets you connect the dots between what you believe about a company’s prospects and what that means for its fair value. Narratives make it easy to create, compare and update your investment thesis on Simply Wall St’s Community page, a feature used by millions worldwide.
By shaping your own Narrative, you can confidently decide whether to buy or sell because you see clearly how your estimated fair value stacks up against the current share price. Narratives are updated automatically as new news or earnings emerge, so your view stays relevant. For example, some investors in the MNTN community see long-term upside and a potential fair value above $120. Others, more concerned by industry risks, calculate a fair value closer to $30. Narratives empower every investor to see both the numbers and the story in one simple, accessible tool.
Do you think there's more to the story for MNTN? Head over to our Community to see what others are saying!
This article by Simply Wall St is general in nature. We provide commentary based on historical data and analyst forecasts only using an unbiased methodology and our articles are not intended to be financial advice. It does not constitute a recommendation to buy or sell any stock, and does not take account of your objectives, or your financial situation. We aim to bring you long-term focused analysis driven by fundamental data. Note that our analysis may not factor in the latest price-sensitive company announcements or qualitative material. Simply Wall St has no position in any stocks mentioned.
New: Manage All Your Stock Portfolios in One Place
We've created the ultimate portfolio companion for stock investors, and it's free.
• Connect an unlimited number of Portfolios and see your total in one currency
• Be alerted to new Warning Signs or Risks via email or mobile
• Track the Fair Value of your stocks
Have feedback on this article? Concerned about the content? Get in touch with us directly. Alternatively, email editorial-team@simplywallst.com
About NYSE:MNTN
MNTN
Operates a technology platform that brings performance marketing to Connected TV.
Flawless balance sheet with high growth potential.
Market Insights

Advertisement
Community Narratives
The company that turned a verb into a global necessity and basically runs the modern internet, digital ads, smartphones, maps, and AI.
Fair Value US$300.00|7.5% undervalued
OS
Community Contributor
Flowers Foods Pays A Fair Price For Health
Fair Value US$16.12|25.4% undervalued
NV
Community Contributor
TMX Group will thrive with 33.3% profit margin and enduring market moat
Fair Value CA$49.90|3.6% overvalued
LI
Community Contributor
The "Molecular Pencil": Why Beam's Technology is Built to Win
Fair Value US$65.01|65.0% undervalued
DA
Community Contributor