
Advertisement
- United States
- /
- Media
- /
- NasdaqGM:TTGT
Despite Its High P/E Ratio, Is TechTarget, Inc. (NASDAQ:TTGT) Still Undervalued?

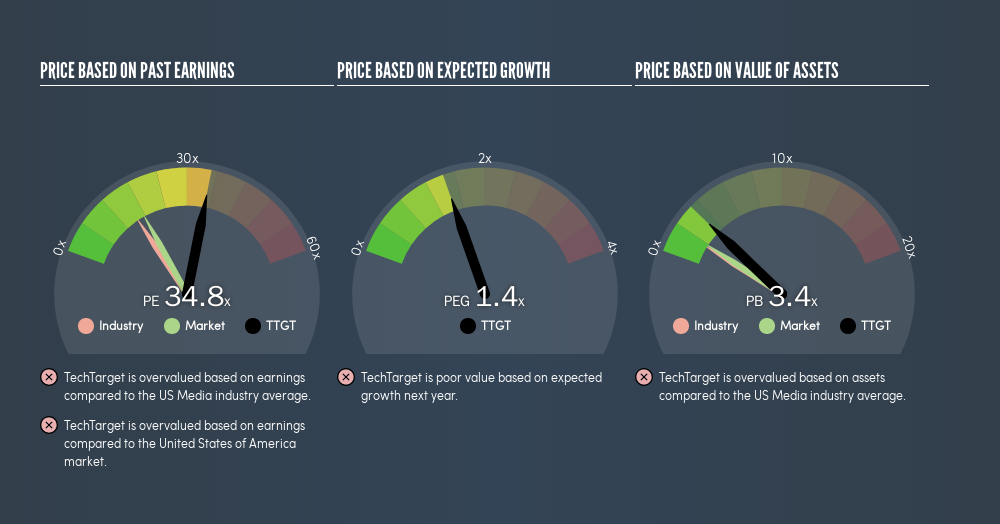
This article is for investors who would like to improve their understanding of price to earnings ratios (P/E ratios). We'll show how you can use TechTarget, Inc.'s (NASDAQ:TTGT) P/E ratio to inform your assessment of the investment opportunity. TechTarget has a P/E ratio of 34.84, based on the last twelve months. That means that at current prices, buyers pay $34.84 for every $1 in trailing yearly profits.
View our latest analysis for TechTarget
How Do I Calculate A Price To Earnings Ratio?
The formula for price to earnings is:
Price to Earnings Ratio = Price per Share ÷ Earnings per Share (EPS)
Or for TechTarget:
P/E of 34.84 = $16.27 ÷ $0.47 (Based on the trailing twelve months to December 2018.)
Is A High P/E Ratio Good?
A higher P/E ratio means that buyers have to pay a higher price for each $1 the company has earned over the last year. That isn't necessarily good or bad, but a high P/E implies relatively high expectations of what a company can achieve in the future.
How Growth Rates Impact P/E Ratios
Earnings growth rates have a big influence on P/E ratios. That's because companies that grow earnings per share quickly will rapidly increase the 'E' in the equation. Therefore, even if you pay a high multiple of earnings now, that multiple will become lower in the future. So while a stock may look expensive based on past earnings, it could be cheap based on future earnings.
It's nice to see that TechTarget grew EPS by a stonking 89% in the last year. And its annual EPS growth rate over 5 years is 39%. With that performance, I would expect it to have an above average P/E ratio.
How Does TechTarget's P/E Ratio Compare To Its Peers?
The P/E ratio essentially measures market expectations of a company. As you can see below, TechTarget has a higher P/E than the average company (15.6) in the media industry.
That means that the market expects TechTarget will outperform other companies in its industry. The market is optimistic about the future, but that doesn't guarantee future growth. So further research is always essential. I often monitor director buying and selling.
Remember: P/E Ratios Don't Consider The Balance Sheet
The 'Price' in P/E reflects the market capitalization of the company. Thus, the metric does not reflect cash or debt held by the company. In theory, a company can lower its future P/E ratio by using cash or debt to invest in growth.
Spending on growth might be good or bad a few years later, but the point is that the P/E ratio does not account for the option (or lack thereof).
TechTarget's Balance Sheet
TechTarget has net cash of US$10m. That should lead to a higher P/E than if it did have debt, because its strong balance sheets gives it more options.
The Bottom Line On TechTarget's P/E Ratio
TechTarget has a P/E of 34.8. That's higher than the average in the US market, which is 17.7. With cash in the bank the company has plenty of growth options -- and it is already on the right track. Therefore it seems reasonable that the market would have relatively high expectations of the company
Investors should be looking to buy stocks that the market is wrong about. People often underestimate remarkable growth -- so investors can make money when fast growth is not fully appreciated. So this freevisual report on analyst forecasts could hold the key to an excellent investment decision.
Of course, you might find a fantastic investment by looking at a few good candidates. So take a peek at this freelist of companies with modest (or no) debt, trading on a P/E below 20.
We aim to bring you long-term focused research analysis driven by fundamental data. Note that our analysis may not factor in the latest price-sensitive company announcements or qualitative material.
If you spot an error that warrants correction, please contact the editor at editorial-team@simplywallst.com. This article by Simply Wall St is general in nature. It does not constitute a recommendation to buy or sell any stock, and does not take account of your objectives, or your financial situation. Simply Wall St has no position in the stocks mentioned. Thank you for reading.
About NasdaqGM:TTGT
TechTarget
Provides marketing and sales services that deliver business impact for business-to-business technology companies in North America and internationally.
Moderate growth potential and slightly overvalued.
Similar Companies
Market Insights

Advertisement
Community Narratives
Vita Life Sciences Set for a 12.72% Revenue Growth While Tackling Operational Challenges
Fair Value AU$2.42|14.9% undervalued
RO
Community Contributor
Vossloh rides a €500 billion wave to boost growth and earnings in the next decade
Fair Value €78.41|4.0% undervalued
CH
Community Contributor
Intuitive Surgical Will Transform Healthcare with 12% Revenue Growth
Fair Value US$325.55|59.4% overvalued
UN
Community Contributor