- United States
- /
- Media
- /
- NasdaqCM:SGRP
SPAR Group, Inc.'s (NASDAQ:SGRP) Stock On An Uptrend: Could Fundamentals Be Driving The Momentum?
SPAR Group (NASDAQ:SGRP) has had a great run on the share market with its stock up by a significant 58% over the last three months. We wonder if and what role the company's financials play in that price change as a company's long-term fundamentals usually dictate market outcomes. In this article, we decided to focus on SPAR Group's ROE.
ROE or return on equity is a useful tool to assess how effectively a company can generate returns on the investment it received from its shareholders. In simpler terms, it measures the profitability of a company in relation to shareholder's equity.
Check out our latest analysis for SPAR Group
How To Calculate Return On Equity?
Return on equity can be calculated by using the formula:
Return on Equity = Net Profit (from continuing operations) ÷ Shareholders' Equity
So, based on the above formula, the ROE for SPAR Group is:
14% = US$4.6m ÷ US$32m (Based on the trailing twelve months to September 2020).
The 'return' is the income the business earned over the last year. Another way to think of that is that for every $1 worth of equity, the company was able to earn $0.14 in profit.
What Is The Relationship Between ROE And Earnings Growth?
So far, we've learned that ROE is a measure of a company's profitability. Depending on how much of these profits the company reinvests or "retains", and how effectively it does so, we are then able to assess a company’s earnings growth potential. Assuming all else is equal, companies that have both a higher return on equity and higher profit retention are usually the ones that have a higher growth rate when compared to companies that don't have the same features.
SPAR Group's Earnings Growth And 14% ROE
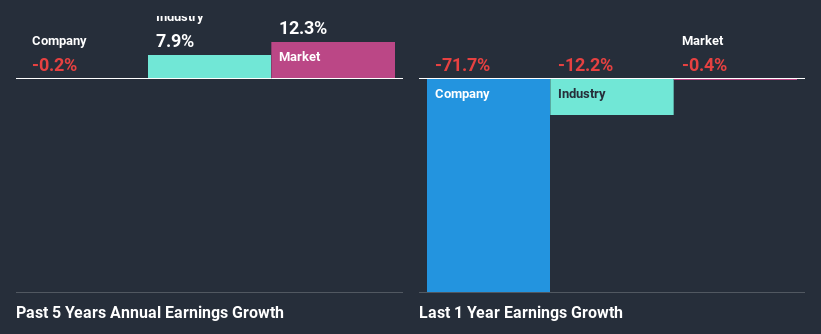
At first glance, SPAR Group seems to have a decent ROE. On comparing with the average industry ROE of 12% the company's ROE looks pretty remarkable. Despite this, SPAR Group's five year net income growth was quite flat over the past five years. Therefore, there could be some other aspects that could potentially be preventing the company from growing. Such as, the company pays out a huge portion of its earnings as dividends, or is faced with competitive pressures.
As a next step, we compared SPAR Group's net income growth with the industry and discovered that the industry saw an average growth of 7.9% in the same period.

Earnings growth is an important metric to consider when valuing a stock. It’s important for an investor to know whether the market has priced in the company's expected earnings growth (or decline). This then helps them determine if the stock is placed for a bright or bleak future. If you're wondering about SPAR Group's's valuation, check out this gauge of its price-to-earnings ratio, as compared to its industry.
Is SPAR Group Efficiently Re-investing Its Profits?
Summary
On the whole, we do feel that SPAR Group has some positive attributes. However, given the high ROE and high profit retention, we would expect the company to be delivering strong earnings growth, but that isn't the case here. This suggests that there might be some external threat to the business, that's hampering its growth. Until now, we have only just grazed the surface of the company's past performance by looking at the company's fundamentals. So it may be worth checking this free detailed graph of SPAR Group's past earnings, as well as revenue and cash flows to get a deeper insight into the company's performance.
When trading SPAR Group or any other investment, use the platform considered by many to be the Professional's Gateway to the Worlds Market, Interactive Brokers. You get the lowest-cost* trading on stocks, options, futures, forex, bonds and funds worldwide from a single integrated account. Promoted
New: Manage All Your Stock Portfolios in One Place
We've created the ultimate portfolio companion for stock investors, and it's free.
• Connect an unlimited number of Portfolios and see your total in one currency
• Be alerted to new Warning Signs or Risks via email or mobile
• Track the Fair Value of your stocks
This article by Simply Wall St is general in nature. It does not constitute a recommendation to buy or sell any stock, and does not take account of your objectives, or your financial situation. We aim to bring you long-term focused analysis driven by fundamental data. Note that our analysis may not factor in the latest price-sensitive company announcements or qualitative material. Simply Wall St has no position in any stocks mentioned.
*Interactive Brokers Rated Lowest Cost Broker by StockBrokers.com Annual Online Review 2020
Have feedback on this article? Concerned about the content? Get in touch with us directly. Alternatively, email editorial-team (at) simplywallst.com.
About NasdaqCM:SGRP
SPAR Group
Provides merchandising and brand marketing services in the Americas, the Asia-Pacific, Europe, the Middle East, and Africa.
Low risk and slightly overvalued.
Similar Companies
Market Insights
Community Narratives


