Advertisement
- United States
- /
- Media
- /
- NasdaqGS:PSKY
Paramount Skydance (PSKY): Evaluating the Valuation After a Month of Volatility

Simply Wall St
Reviewed by Simply Wall St
Paramount Skydance (PSKY) shares have been anything but quiet lately. Over the past month, the stock has slipped about 19%. In contrast, its performance over the past three months shows a 25% gain. Investors are sorting through these swings for clues on what may come next.
See our latest analysis for Paramount Skydance.
Zooming out, Paramount Skydance's share price has seen dramatic momentum swings this year, with the recent one-month pullback following a surge of over 45% year-to-date and a 42% total shareholder return over the last year. While the latest dip has caught some by surprise, it comes in the context of substantial long-term gains. This suggests that this is a stock where momentum can change quickly and investors are recalibrating their expectations.
If you’re interested in expanding your investing radar beyond media shakeups, now’s a great moment to discover fast growing stocks with high insider ownership.
With shares coming off big gains but now trading near analysts’ price targets, the question is whether Paramount Skydance is offering hidden value to investors or if the market has already factored in all its future growth.
Price-to-Sales Ratio of 0.6x: Is it justified?
At last close, Paramount Skydance’s price-to-sales ratio of 0.6x stands out as notably low. This suggests the shares may be trading at a discount compared to both peers and the industry.
The price-to-sales (P/S) ratio measures the company’s value in relation to its revenue. For media stocks, this multiple is helpful since earnings and profit can fluctuate significantly. Revenue provides a steadier frame of reference, especially for unprofitable companies like Paramount Skydance.
This 0.6x P/S ratio is well below the US Media industry average of 1x and further below the peer average of 2.7x. This signals the market may be underestimating the company’s revenue prospects. Notably, analysis also points out that based on regression-derived fair value, a P/S ratio closer to 1.7x could be justified for Paramount Skydance. This indicates there is scope for the valuation multiple to rerate higher if sentiment shifts.
Explore the SWS fair ratio for Paramount Skydance
Result: Price-to-Sales of 0.6x (UNDERVALUED)
However, persistent net losses and the stock trading near price targets could limit further upside if revenue growth slows or sentiment weakens.
Find out about the key risks to this Paramount Skydance narrative.
Another View: What Our DCF Model Says
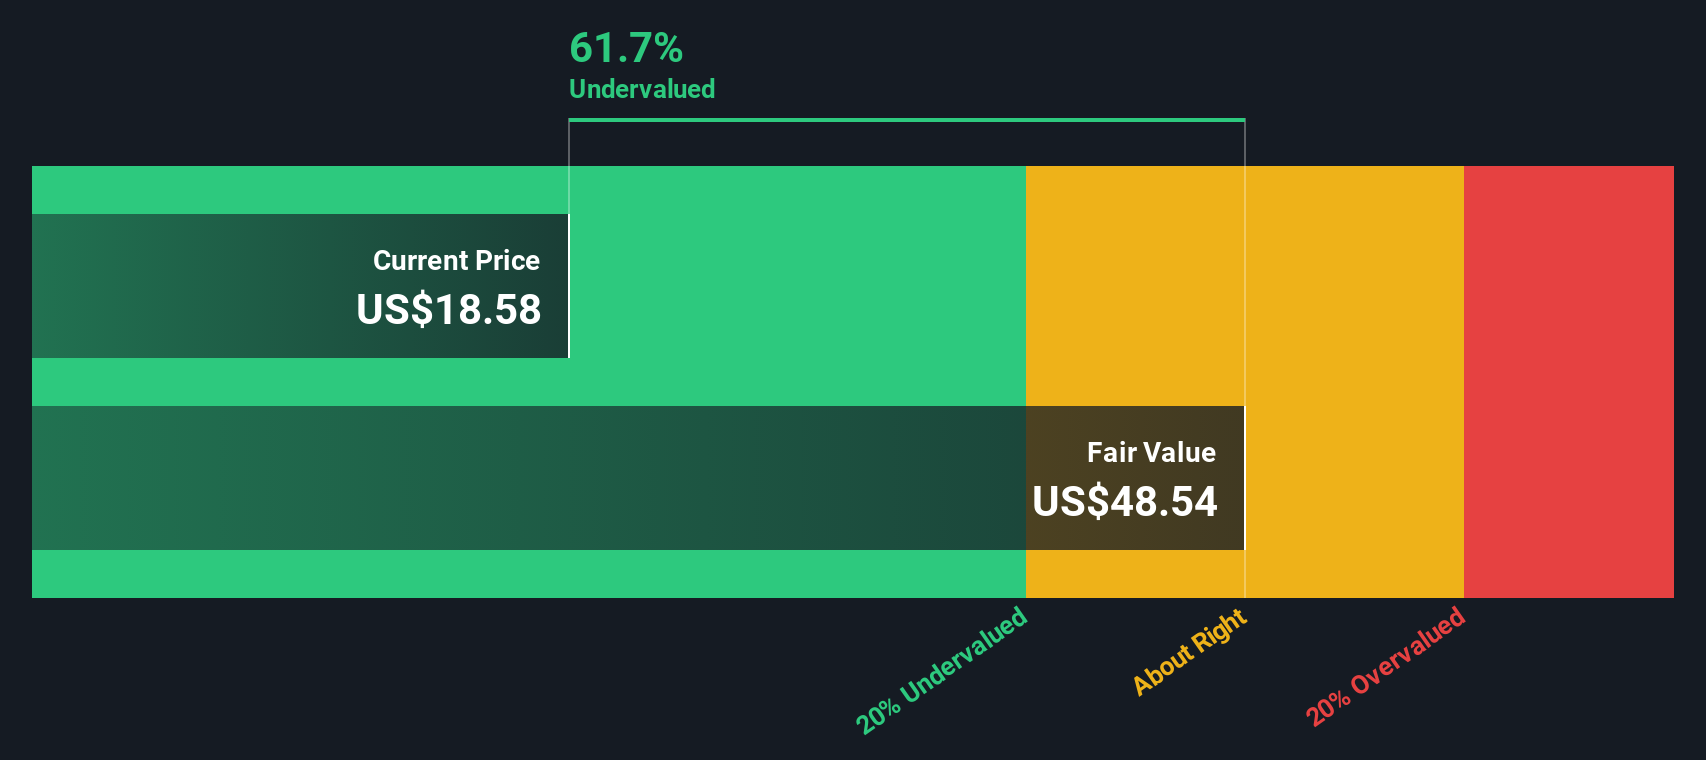
While price-to-sales suggests Paramount Skydance may be undervalued, the SWS DCF model paints an even starker picture. According to our DCF analysis, the current share price of $15.39 sits well below the estimated fair value of $52.80. This result indicates a substantial margin of undervaluation. Is the market missing something significant, or are there risks not fully captured here?
Look into how the SWS DCF model arrives at its fair value.
Simply Wall St performs a discounted cash flow (DCF) on every stock in the world every day (check out Paramount Skydance for example). We show the entire calculation in full. You can track the result in your watchlist or portfolio and be alerted when this changes, or use our stock screener to discover 839 undervalued stocks based on their cash flows. If you save a screener we even alert you when new companies match - so you never miss a potential opportunity.
Build Your Own Paramount Skydance Narrative
If you think there's another angle to consider or want to dig into the numbers yourself, creating your own story takes just a few minutes, so Do it your way.
A great starting point for your Paramount Skydance research is our analysis highlighting 3 key rewards and 3 important warning signs that could impact your investment decision.
Looking for More Investment Ideas?
Smart investors keep their radar up for the next big play. Don’t miss your chance to uncover sectors powering tomorrow’s gains with these handpicked opportunities:
- Unlock potential income streams and reliable yields by tapping into these 23 dividend stocks with yields > 3% with strong financials and consistent performance.
- Spot tomorrow’s tech disruptors before they break out by checking out these 26 AI penny stocks leading the AI transformation in multiple industries.
- Capitalize on true bargains others might overlook with these 839 undervalued stocks based on cash flows that show compelling value based on future cash flows.
This article by Simply Wall St is general in nature. We provide commentary based on historical data and analyst forecasts only using an unbiased methodology and our articles are not intended to be financial advice. It does not constitute a recommendation to buy or sell any stock, and does not take account of your objectives, or your financial situation. We aim to bring you long-term focused analysis driven by fundamental data. Note that our analysis may not factor in the latest price-sensitive company announcements or qualitative material. Simply Wall St has no position in any stocks mentioned.
New: Manage All Your Stock Portfolios in One Place
We've created the ultimate portfolio companion for stock investors, and it's free.
• Connect an unlimited number of Portfolios and see your total in one currency
• Be alerted to new Warning Signs or Risks via email or mobile
• Track the Fair Value of your stocks
Have feedback on this article? Concerned about the content? Get in touch with us directly. Alternatively, email editorial-team@simplywallst.com
About NasdaqGS:PSKY
Paramount Skydance
Operates as a media and entertainment company worldwide.
Undervalued with moderate growth potential.
Similar Companies
Market Insights

Advertisement
Community Narratives
The company that turned a verb into a global necessity and basically runs the modern internet, digital ads, smartphones, maps, and AI.
Fair Value US$300.00|6.3% undervalued
OS
Community Contributor
Flowers Foods Pays A Fair Price For Health
Fair Value US$16.12|26.0% undervalued
NV
Community Contributor
TMX Group will thrive with 33.3% profit margin and enduring market moat
Fair Value CA$49.90|3.7% overvalued
LI
Community Contributor