Advertisement
- United States
- /
- Entertainment
- /
- NasdaqCM:MYPS
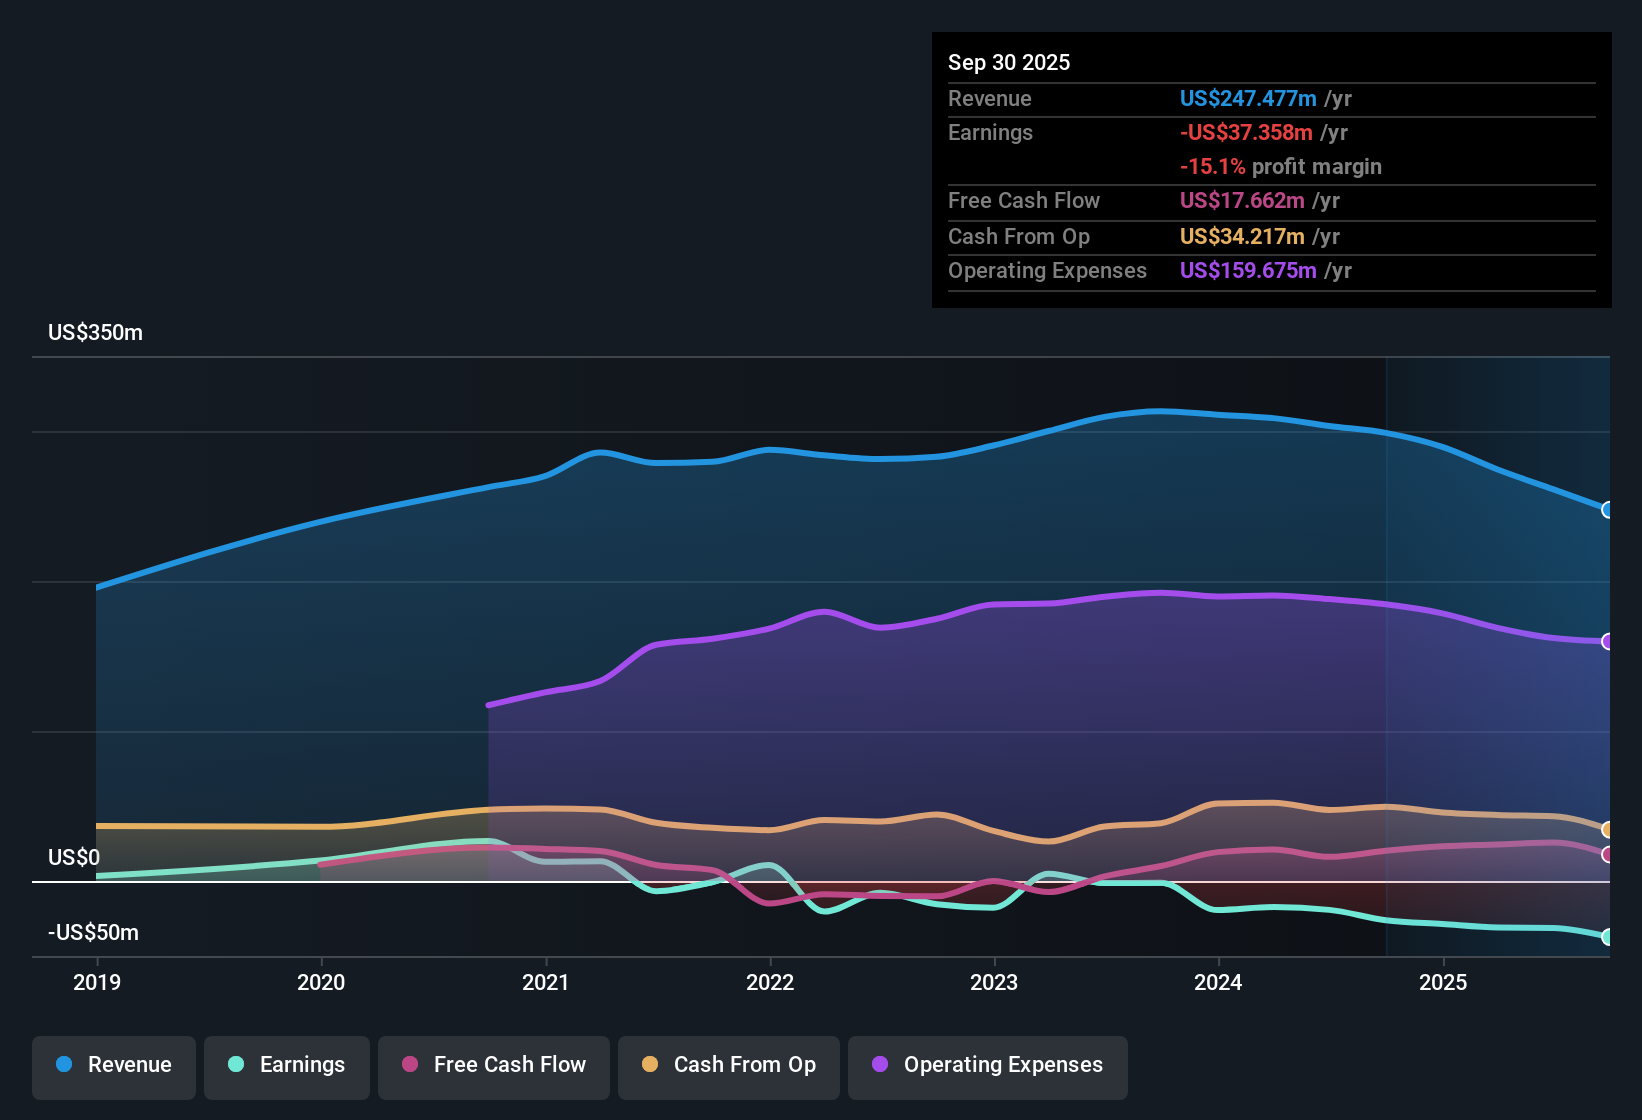
PLAYSTUDIOS (MYPS) Losses Accelerate 56.9% Annually, Undercutting Bullish Recovery Narratives
PLAYSTUDIOS (MYPS) saw its losses accelerate at an average rate of 56.9% per year over the last five years, and the company remains unprofitable, with forecasts calling for continued losses through the next three years. Revenue is also projected to decline by 2.1% annually, adding further pressure on profit margins. Despite these tough numbers, MYPS trades at $0.82, a notable discount to its estimated fair value of $3.40. Valuation metrics stand out versus peers in the sector.
See our full analysis for PLAYSTUDIOS.Now, let’s see how these results hold up against the market’s big narratives. Which stories stick, and which ones get a reality check?
Curious how numbers become stories that shape markets? Explore Community Narratives
Losses Deepen, Outlook Remains Negative
- Over the past five years, PLAYSTUDIOS' losses have increased at an annualized rate of 56.9%. Forecasts point to continued unprofitability for at least the next three years.
- What stands out in the prevailing market view is that, despite management’s optimism in ongoing platform innovation, the persistent acceleration of losses creates a tough hurdle for bullish hopes.
- Bulls often highlight product evolution and new partnerships. However, the sustained negative trajectory for earnings means these positives have yet to materially offset the core profitability challenge.
- The inability to halt the rate of loss expansion suggests structural issues with the current business model, not just temporary execution stumbles.
Revenue Slides, Margins Face Pressure
- Revenue is expected to decline at an average rate of 2.1% annually, tightening the squeeze on profit margins and leaving little room for organic improvement in the near term.
- The prevailing market view reflects rising concern that, even with sector trends of consolidation and monetization innovation, MYPS's shrinking top line magnifies questions about its long-term scalability.
- Critics highlight how falling sales contrast sharply with industry peers who maintain at least stable or growing revenues, raising red flags about customer retention and competitive positioning.
- Consensus among cautious observers is that margin recovery will remain elusive as long as core revenues erode year over year.
Valuation Discount Stands Out Amid Losses
- MYPS trades at just 0.4x Price-To-Sales versus a sector average of 1.2x, and its $0.82 share price sits well below the calculated DCF fair value of $3.40. This offers a steep discount relative to both peers and its own projected intrinsic worth.
- Prevailing market analysis points out that, while this valuation gap might tempt value-oriented investors, the discount primarily reflects persistent losses and negative sentiment around earnings trends.
- The low Price-To-Sales ratio is not viewed as a market overreaction but rather as a direct response to ongoing lack of profitability, not simply a hidden opportunity.
- Bulls see the discount as a margin of safety, but without meaningful evidence of a turnaround, most investors are likely to remain wary.
Next Steps
Don't just look at this quarter; the real story is in the long-term trend. We've done an in-depth analysis on PLAYSTUDIOS's growth and its valuation to see if today's price is a bargain. Add the company to your watchlist or portfolio now so you don't miss the next big move.
See What Else Is Out There
MYPS continues to face persistent losses and declining revenues, which puts its path to profitability and long-term business stability in doubt.
If you want to focus on companies demonstrating healthier growth and less volatility, use our stable growth stocks screener (2077 results) to discover those consistently expanding sales and earnings year after year.
This article by Simply Wall St is general in nature. We provide commentary based on historical data and analyst forecasts only using an unbiased methodology and our articles are not intended to be financial advice. It does not constitute a recommendation to buy or sell any stock, and does not take account of your objectives, or your financial situation. We aim to bring you long-term focused analysis driven by fundamental data. Note that our analysis may not factor in the latest price-sensitive company announcements or qualitative material. Simply Wall St has no position in any stocks mentioned.
New: Manage All Your Stock Portfolios in One Place
We've created the ultimate portfolio companion for stock investors, and it's free.
• Connect an unlimited number of Portfolios and see your total in one currency
• Be alerted to new Warning Signs or Risks via email or mobile
• Track the Fair Value of your stocks
Have feedback on this article? Concerned about the content? Get in touch with us directly. Alternatively, email editorial-team@simplywallst.com
About NasdaqCM:MYPS
PLAYSTUDIOS
Develops and publishes free-to-play casual games for mobile and social platforms in the United States and internationally.
Flawless balance sheet and fair value.
Similar Companies
Market Insights


Advertisement
Weekly Picks
LO


Lou_Basenese on Virtuix Holdings ·
From a “Shark Tank” Snub to an Air Force “Yes”: Why Virtuix at $3.50 May Be the Market’s Most Mispriced AI Story
Fair Value:US$7.551.2% undervalued
14 followersusers have followed this narrative
0 commentsusers have commented on this narrative
2 likesusers have liked this narrative
IN


Investingwilly on Mastercard ·
Mastercard: The Best Dividend Stock You're Ignoring
Fair Value:US$75034.1% undervalued
51 followersusers have followed this narrative
1 commentusers have commented on this narrative
6 likesusers have liked this narrative
TR


tripledub on Intuit ·
A Wonderful Business at a Not-So-Wonderful Price
Fair Value:US$56053.2% undervalued
62 followersusers have followed this narrative
2 commentsusers have commented on this narrative
29 likesusers have liked this narrative
TA


Talos on MindWalk Holdings ·
The Asymmetric TechBio Play: MindWalk Holdings and the Valuation Disconnect
Fair Value:US$8.2781.3% undervalued
30 followersusers have followed this narrative
0 commentsusers have commented on this narrative
8 likesusers have liked this narrative
Recently Updated Narratives
JO


John_Eric on ServiceNow ·
The Company Nobody Brags About
Fair Value:US$165.6943.4% undervalued
7 followersusers have followed this narrative
0 commentsusers have commented on this narrative
0 likesusers have liked this narrative
AN


AntonioS on ASX ·
ASX Limited
Fair Value:AU$4319.3% overvalued
1 followerusers have followed this narrative
0 commentsusers have commented on this narrative
0 likesusers have liked this narrative
AN

AntonioS on Auckland International Airport ·
Auckland International Airport (AIA) - Quality is not the question, price is.
Fair Value:NZ$6.234.8% overvalued
1 followerusers have followed this narrative
0 commentsusers have commented on this narrative
0 likesusers have liked this narrative
Popular Narratives
MA


martinarauz on Nu Holdings ·
Investment Analysis (May 2026)
Fair Value:US$22.7445.2% undervalued
67 followersusers have followed this narrative
0 commentsusers have commented on this narrative
16 likesusers have liked this narrative
HA


HarishPK on Adobe ·
Adobe: A Probabilistic Case for Undervaluation
Fair Value:US$319.9638.6% undervalued
61 followersusers have followed this narrative
9 commentsusers have commented on this narrative
18 likesusers have liked this narrative
HE


HedgeY on AST SpaceMobile ·
AST SpaceMobile: The Boldest Direct-to-Cell Bet in Public Markets
Fair Value:US$17060.0% undervalued
51 followersusers have followed this narrative
0 commentsusers have commented on this narrative
13 likesusers have liked this narrative
