
Advertisement
- United States
- /
- Media
- /
- NasdaqGM:HMTV
Hemisphere Media Group (NASDAQ:HMTV) Has A Somewhat Strained Balance Sheet
Legendary fund manager Li Lu (who Charlie Munger backed) once said, 'The biggest investment risk is not the volatility of prices, but whether you will suffer a permanent loss of capital.' When we think about how risky a company is, we always like to look at its use of debt, since debt overload can lead to ruin. We can see that Hemisphere Media Group, Inc. (NASDAQ:HMTV) does use debt in its business. But the more important question is: how much risk is that debt creating?
What Risk Does Debt Bring?
Debt and other liabilities become risky for a business when it cannot easily fulfill those obligations, either with free cash flow or by raising capital at an attractive price. If things get really bad, the lenders can take control of the business. However, a more frequent (but still costly) occurrence is where a company must issue shares at bargain-basement prices, permanently diluting shareholders, just to shore up its balance sheet. Having said that, the most common situation is where a company manages its debt reasonably well - and to its own advantage. When we think about a company's use of debt, we first look at cash and debt together.
View our latest analysis for Hemisphere Media Group
What Is Hemisphere Media Group's Net Debt?
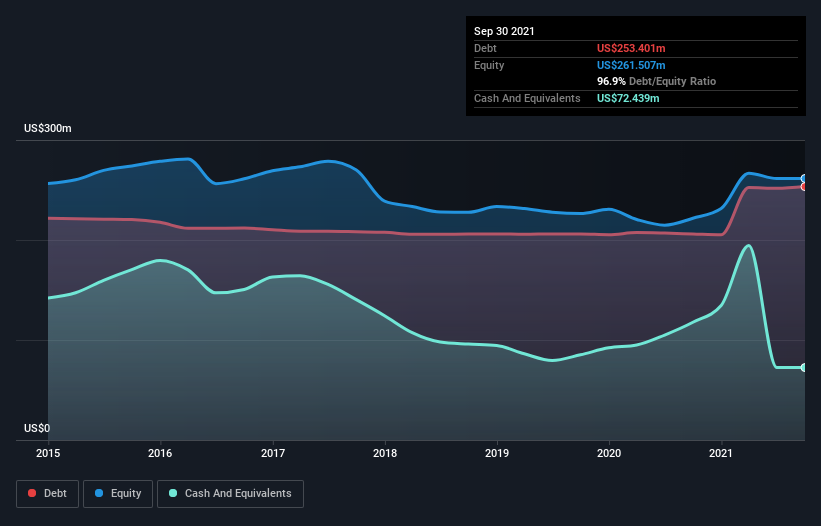
You can click the graphic below for the historical numbers, but it shows that as of June 2021 Hemisphere Media Group had US$253.4m of debt, an increase on US$206.0m, over one year. On the flip side, it has US$72.4m in cash leading to net debt of about US$181.0m.
How Healthy Is Hemisphere Media Group's Balance Sheet?
Zooming in on the latest balance sheet data, we can see that Hemisphere Media Group had liabilities of US$85.1m due within 12 months and liabilities of US$275.9m due beyond that. On the other hand, it had cash of US$72.4m and US$38.6m worth of receivables due within a year. So its liabilities total US$249.9m more than the combination of its cash and short-term receivables.
This deficit is considerable relative to its market capitalization of US$362.2m, so it does suggest shareholders should keep an eye on Hemisphere Media Group's use of debt. Should its lenders demand that it shore up the balance sheet, shareholders would likely face severe dilution.
We use two main ratios to inform us about debt levels relative to earnings. The first is net debt divided by earnings before interest, tax, depreciation, and amortization (EBITDA), while the second is how many times its earnings before interest and tax (EBIT) covers its interest expense (or its interest cover, for short). The advantage of this approach is that we take into account both the absolute quantum of debt (with net debt to EBITDA) and the actual interest expenses associated with that debt (with its interest cover ratio).
While Hemisphere Media Group's debt to EBITDA ratio (4.7) suggests that it uses some debt, its interest cover is very weak, at 2.0, suggesting high leverage. So shareholders should probably be aware that interest expenses appear to have really impacted the business lately. Worse, Hemisphere Media Group's EBIT was down 40% over the last year. If earnings continue to follow that trajectory, paying off that debt load will be harder than convincing us to run a marathon in the rain. There's no doubt that we learn most about debt from the balance sheet. But it is future earnings, more than anything, that will determine Hemisphere Media Group's ability to maintain a healthy balance sheet going forward. So if you want to see what the professionals think, you might find this free report on analyst profit forecasts to be interesting.
Finally, a business needs free cash flow to pay off debt; accounting profits just don't cut it. So the logical step is to look at the proportion of that EBIT that is matched by actual free cash flow. Over the last three years, Hemisphere Media Group actually produced more free cash flow than EBIT. That sort of strong cash conversion gets us as excited as the crowd when the beat drops at a Daft Punk concert.
Our View
To be frank both Hemisphere Media Group's interest cover and its track record of (not) growing its EBIT make us rather uncomfortable with its debt levels. But on the bright side, its conversion of EBIT to free cash flow is a good sign, and makes us more optimistic. Once we consider all the factors above, together, it seems to us that Hemisphere Media Group's debt is making it a bit risky. Some people like that sort of risk, but we're mindful of the potential pitfalls, so we'd probably prefer it carry less debt. When analysing debt levels, the balance sheet is the obvious place to start. But ultimately, every company can contain risks that exist outside of the balance sheet. Be aware that Hemisphere Media Group is showing 3 warning signs in our investment analysis , and 2 of those are significant...
At the end of the day, it's often better to focus on companies that are free from net debt. You can access our special list of such companies (all with a track record of profit growth). It's free.
Valuation is complex, but we're here to simplify it.
Discover if Hemisphere Media Group might be undervalued or overvalued with our detailed analysis, featuring fair value estimates, potential risks, dividends, insider trades, and its financial condition.
Access Free AnalysisThis article by Simply Wall St is general in nature. We provide commentary based on historical data and analyst forecasts only using an unbiased methodology and our articles are not intended to be financial advice. It does not constitute a recommendation to buy or sell any stock, and does not take account of your objectives, or your financial situation. We aim to bring you long-term focused analysis driven by fundamental data. Note that our analysis may not factor in the latest price-sensitive company announcements or qualitative material. Simply Wall St has no position in any stocks mentioned.
Have feedback on this article? Concerned about the content? Get in touch with us directly. Alternatively, email editorial-team (at) simplywallst.com.
About NasdaqGM:HMTV
Hemisphere Media Group
Hemisphere Media Group, Inc. operates as the Spanish-language media company.
Fair value with worrying balance sheet.
Similar Companies
Market Insights

Advertisement
Community Narratives
The company that turned a verb into a global necessity and basically runs the modern internet, digital ads, smartphones, maps, and AI.
Fair Value US$300.00|5.4% undervalued
OS
Community Contributor
Flowers Foods Pays A Fair Price For Health
Fair Value US$16.12|26.3% undervalued
NV
Community Contributor
TMX Group will thrive with 33.3% profit margin and enduring market moat
Fair Value CA$49.90|4.1% overvalued
LI
Community Contributor
The "Molecular Pencil": Why Beam's Technology is Built to Win
Fair Value US$65.01|62.7% undervalued
DA
Community Contributor