Advertisement
- United States
- /
- Entertainment
- /
- NasdaqGS:DDI
There's Reason For Concern Over DoubleDown Interactive Co., Ltd.'s (NASDAQ:DDI) Massive 46% Price Jump
Despite an already strong run, DoubleDown Interactive Co., Ltd. (NASDAQ:DDI) shares have been powering on, with a gain of 46% in the last thirty days. The last 30 days bring the annual gain to a very sharp 40%.
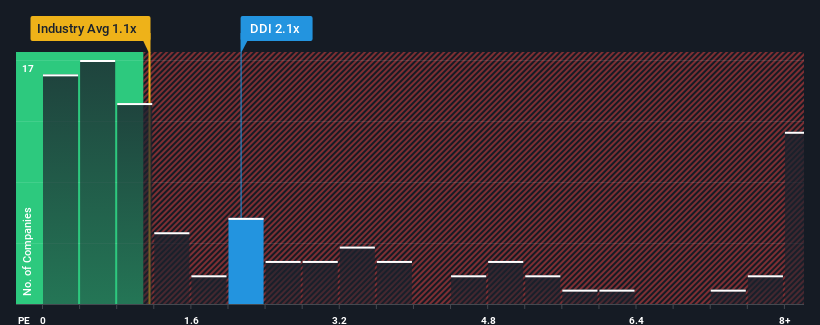
After such a large jump in price, given close to half the companies operating in the United States' Entertainment industry have price-to-sales ratios (or "P/S") below 1.1x, you may consider DoubleDown Interactive as a stock to potentially avoid with its 2.1x P/S ratio. However, the P/S might be high for a reason and it requires further investigation to determine if it's justified.
View our latest analysis for DoubleDown Interactive
What Does DoubleDown Interactive's Recent Performance Look Like?
DoubleDown Interactive could be doing better as its revenue has been going backwards lately while most other companies have been seeing positive revenue growth. One possibility is that the P/S ratio is high because investors think this poor revenue performance will turn the corner. However, if this isn't the case, investors might get caught out paying too much for the stock.
Keen to find out how analysts think DoubleDown Interactive's future stacks up against the industry? In that case, our free report is a great place to start.What Are Revenue Growth Metrics Telling Us About The High P/S?
There's an inherent assumption that a company should outperform the industry for P/S ratios like DoubleDown Interactive's to be considered reasonable.
Taking a look back first, the company's revenue growth last year wasn't something to get excited about as it posted a disappointing decline of 6.2%. As a result, revenue from three years ago have also fallen 21% overall. Accordingly, shareholders would have felt downbeat about the medium-term rates of revenue growth.
Looking ahead now, revenue is anticipated to climb by 2.6% per year during the coming three years according to the three analysts following the company. Meanwhile, the rest of the industry is forecast to expand by 9.9% per year, which is noticeably more attractive.
In light of this, it's alarming that DoubleDown Interactive's P/S sits above the majority of other companies. It seems most investors are hoping for a turnaround in the company's business prospects, but the analyst cohort is not so confident this will happen. There's a good chance these shareholders are setting themselves up for future disappointment if the P/S falls to levels more in line with the growth outlook.
What Does DoubleDown Interactive's P/S Mean For Investors?
DoubleDown Interactive's P/S is on the rise since its shares have risen strongly. It's argued the price-to-sales ratio is an inferior measure of value within certain industries, but it can be a powerful business sentiment indicator.
Despite analysts forecasting some poorer-than-industry revenue growth figures for DoubleDown Interactive, this doesn't appear to be impacting the P/S in the slightest. The weakness in the company's revenue estimate doesn't bode well for the elevated P/S, which could take a fall if the revenue sentiment doesn't improve. This places shareholders' investments at significant risk and potential investors in danger of paying an excessive premium.
The company's balance sheet is another key area for risk analysis. Our free balance sheet analysis for DoubleDown Interactive with six simple checks will allow you to discover any risks that could be an issue.
It's important to make sure you look for a great company, not just the first idea you come across. So if growing profitability aligns with your idea of a great company, take a peek at this free list of interesting companies with strong recent earnings growth (and a low P/E).
New: Manage All Your Stock Portfolios in One Place
We've created the ultimate portfolio companion for stock investors, and it's free.
• Connect an unlimited number of Portfolios and see your total in one currency
• Be alerted to new Warning Signs or Risks via email or mobile
• Track the Fair Value of your stocks
Have feedback on this article? Concerned about the content? Get in touch with us directly. Alternatively, email editorial-team (at) simplywallst.com.
This article by Simply Wall St is general in nature. We provide commentary based on historical data and analyst forecasts only using an unbiased methodology and our articles are not intended to be financial advice. It does not constitute a recommendation to buy or sell any stock, and does not take account of your objectives, or your financial situation. We aim to bring you long-term focused analysis driven by fundamental data. Note that our analysis may not factor in the latest price-sensitive company announcements or qualitative material. Simply Wall St has no position in any stocks mentioned.
About NasdaqGS:DDI
DoubleDown Interactive
Develops and publishes casual games and mobile applications in South Korea, the United States, the United Kingdom, Germany, and internationally.
Flawless balance sheet and undervalued.
Similar Companies
Market Insights


Advertisement
Weekly Picks
LO


Lou_Basenese on Cue Biopharma ·
Cue Biopharma (NASDAQ: CUE): The Scientist Behind Xolair Just Gave Cue a Next-Generation Shot at the Same Multi-Billion-Dollar Market
Fair Value:US$7065.0% undervalued
41 followersusers have followed this narrative
0 commentsusers have commented on this narrative
8 likesusers have liked this narrative
HA


HarishPK on Adobe ·
Adobe: A Probabilistic Case for Undervaluation
Fair Value:US$319.9636.2% undervalued
45 followersusers have followed this narrative
8 commentsusers have commented on this narrative
15 likesusers have liked this narrative
NI


niteco on Broadcom ·
A Capital Allocation Favorite with Structural Importance
Fair Value:US$651.0541.3% undervalued
45 followersusers have followed this narrative
0 commentsusers have commented on this narrative
8 likesusers have liked this narrative
TO


Tokyo on Okta ·
Good foundation, but now it's all about the next steps
Fair Value:US$15123.0% undervalued
91 followersusers have followed this narrative
7 commentsusers have commented on this narrative
11 likesusers have liked this narrative
Recently Updated Narratives
LY

Lyra on Giftify ·
What is Giftify (GIFT) Really Worth? An Honest Risk-Discount Valuation
Fair Value:US$0.653.3% overvalued
1 followerusers have followed this narrative
0 commentsusers have commented on this narrative
0 likesusers have liked this narrative
LY

Lyra on Eos Energy Enterprises ·
EOS Energy: The Zinc Rocket with Two Classes on
Fair Value:US$3.289.4% overvalued
1 followerusers have followed this narrative
0 commentsusers have commented on this narrative
0 likesusers have liked this narrative
GE

Germaine on A1 A.K. Koh Group Berhad ·
A1: New Product Penetration Strengthens Existing Retail Network
Fair Value:RM 0.1140.9% overvalued
1 followerusers have followed this narrative
0 commentsusers have commented on this narrative
0 likesusers have liked this narrative
Popular Narratives
MA


martinarauz on Nu Holdings ·
Investment Analysis (May 2026)
Fair Value:US$22.7446.4% undervalued
66 followersusers have followed this narrative
0 commentsusers have commented on this narrative
16 likesusers have liked this narrative
CL


Clive_Thompson on Take-Two Interactive Software ·
Take-Two Interactive: The Calm Before the Storm NASDAQ: TTWO Last Price: $242.41 Date: May 15, 2026
Fair Value:US$276.9723.5% undervalued
58 followersusers have followed this narrative
0 commentsusers have commented on this narrative
14 likesusers have liked this narrative
NI

niteco on Honeywell International ·
Honeywell - The Demand-Side of the AI Infrastructure
Fair Value:US$320.1931.2% undervalued
49 followersusers have followed this narrative
0 commentsusers have commented on this narrative
19 likesusers have liked this narrative
