
Advertisement
- United States
- /
- Entertainment
- /
- NasdaqGS:DDI
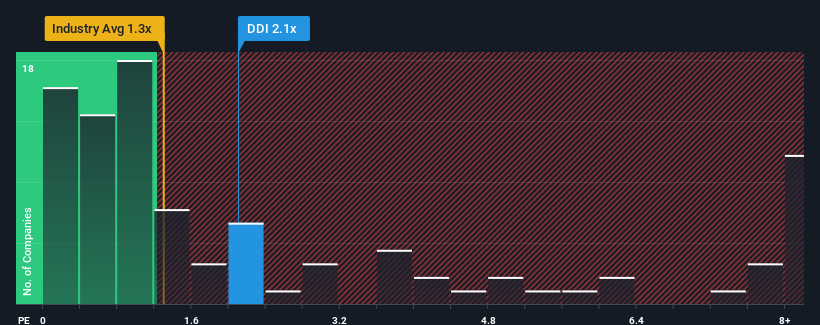
Revenues Not Telling The Story For DoubleDown Interactive Co., Ltd. (NASDAQ:DDI) After Shares Rise 28%
DoubleDown Interactive Co., Ltd. (NASDAQ:DDI) shares have had a really impressive month, gaining 28% after a shaky period beforehand. Looking back a bit further, it's encouraging to see the stock is up 51% in the last year.
Since its price has surged higher, when almost half of the companies in the United States' Entertainment industry have price-to-sales ratios (or "P/S") below 1.3x, you may consider DoubleDown Interactive as a stock probably not worth researching with its 2.1x P/S ratio. Nonetheless, we'd need to dig a little deeper to determine if there is a rational basis for the elevated P/S.
See our latest analysis for DoubleDown Interactive
What Does DoubleDown Interactive's Recent Performance Look Like?
DoubleDown Interactive could be doing better as it's been growing revenue less than most other companies lately. One possibility is that the P/S ratio is high because investors think this lacklustre revenue performance will improve markedly. If not, then existing shareholders may be very nervous about the viability of the share price.
If you'd like to see what analysts are forecasting going forward, you should check out our free report on DoubleDown Interactive.How Is DoubleDown Interactive's Revenue Growth Trending?
There's an inherent assumption that a company should outperform the industry for P/S ratios like DoubleDown Interactive's to be considered reasonable.
Taking a look back first, we see that there was hardly any revenue growth to speak of for the company over the past year. This isn't what shareholders were looking for as it means they've been left with a 19% decline in revenue over the last three years in total. Accordingly, shareholders would have felt downbeat about the medium-term rates of revenue growth.
Looking ahead now, revenue is anticipated to climb by 7.1% during the coming year according to the three analysts following the company. That's shaping up to be materially lower than the 11% growth forecast for the broader industry.
With this information, we find it concerning that DoubleDown Interactive is trading at a P/S higher than the industry. It seems most investors are hoping for a turnaround in the company's business prospects, but the analyst cohort is not so confident this will happen. There's a good chance these shareholders are setting themselves up for future disappointment if the P/S falls to levels more in line with the growth outlook.
What Does DoubleDown Interactive's P/S Mean For Investors?
DoubleDown Interactive shares have taken a big step in a northerly direction, but its P/S is elevated as a result. Using the price-to-sales ratio alone to determine if you should sell your stock isn't sensible, however it can be a practical guide to the company's future prospects.
Despite analysts forecasting some poorer-than-industry revenue growth figures for DoubleDown Interactive, this doesn't appear to be impacting the P/S in the slightest. Right now we aren't comfortable with the high P/S as the predicted future revenues aren't likely to support such positive sentiment for long. This places shareholders' investments at significant risk and potential investors in danger of paying an excessive premium.
You should always think about risks. Case in point, we've spotted 1 warning sign for DoubleDown Interactive you should be aware of.
If companies with solid past earnings growth is up your alley, you may wish to see this free collection of other companies with strong earnings growth and low P/E ratios.
New: Manage All Your Stock Portfolios in One Place
We've created the ultimate portfolio companion for stock investors, and it's free.
• Connect an unlimited number of Portfolios and see your total in one currency
• Be alerted to new Warning Signs or Risks via email or mobile
• Track the Fair Value of your stocks
Have feedback on this article? Concerned about the content? Get in touch with us directly. Alternatively, email editorial-team (at) simplywallst.com.
This article by Simply Wall St is general in nature. We provide commentary based on historical data and analyst forecasts only using an unbiased methodology and our articles are not intended to be financial advice. It does not constitute a recommendation to buy or sell any stock, and does not take account of your objectives, or your financial situation. We aim to bring you long-term focused analysis driven by fundamental data. Note that our analysis may not factor in the latest price-sensitive company announcements or qualitative material. Simply Wall St has no position in any stocks mentioned.
About NasdaqGS:DDI
DoubleDown Interactive
Engages in the development and publishing of casual games and mobile applications in South Korea.
Very undervalued with flawless balance sheet.
Similar Companies
Market Insights

Advertisement
Community Narratives
MicroVision will explode future revenue by 380.37% with a vision towards success
Fair Value US$60.00|98.4% undervalued
TH
Community Contributor
The Indispensable Artery for a New North American Economy
Fair Value CA$132.87|1.3% undervalued
TI
Community Contributor