
Advertisement
Legendary fund manager Li Lu (who Charlie Munger backed) once said, 'The biggest investment risk is not the volatility of prices, but whether you will suffer a permanent loss of capital.' When we think about how risky a company is, we always like to look at its use of debt, since debt overload can lead to ruin. Importantly, Newmont Corporation (NYSE:NEM) does carry debt. But the real question is whether this debt is making the company risky.
What Risk Does Debt Bring?
Generally speaking, debt only becomes a real problem when a company can't easily pay it off, either by raising capital or with its own cash flow. In the worst case scenario, a company can go bankrupt if it cannot pay its creditors. However, a more common (but still painful) scenario is that it has to raise new equity capital at a low price, thus permanently diluting shareholders. Having said that, the most common situation is where a company manages its debt reasonably well - and to its own advantage. The first step when considering a company's debt levels is to consider its cash and debt together.
See our latest analysis for Newmont
How Much Debt Does Newmont Carry?
The image below, which you can click on for greater detail, shows that Newmont had debt of US$5.65b at the end of December 2021, a reduction from US$6.03b over a year. However, it does have US$5.07b in cash offsetting this, leading to net debt of about US$578.0m.
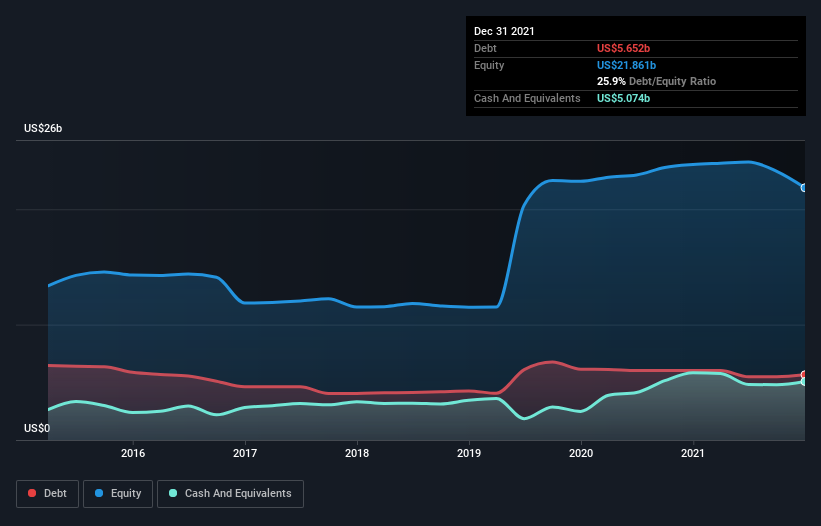
How Healthy Is Newmont's Balance Sheet?
The latest balance sheet data shows that Newmont had liabilities of US$2.65b due within a year, and liabilities of US$16.0b falling due after that. On the other hand, it had cash of US$5.07b and US$337.0m worth of receivables due within a year. So it has liabilities totalling US$13.3b more than its cash and near-term receivables, combined.
While this might seem like a lot, it is not so bad since Newmont has a huge market capitalization of US$60.5b, and so it could probably strengthen its balance sheet by raising capital if it needed to. However, it is still worthwhile taking a close look at its ability to pay off debt. But either way, Newmont has virtually no net debt, so it's fair to say it does not have a heavy debt load!
We measure a company's debt load relative to its earnings power by looking at its net debt divided by its earnings before interest, tax, depreciation, and amortization (EBITDA) and by calculating how easily its earnings before interest and tax (EBIT) cover its interest expense (interest cover). The advantage of this approach is that we take into account both the absolute quantum of debt (with net debt to EBITDA) and the actual interest expenses associated with that debt (with its interest cover ratio).
With net debt sitting at just 0.13 times EBITDA, Newmont is arguably pretty conservatively geared. And this view is supported by the solid interest coverage, with EBIT coming in at 8.1 times the interest expense over the last year. It is just as well that Newmont's load is not too heavy, because its EBIT was down 39% over the last year. When it comes to paying off debt, falling earnings are no more useful than sugary sodas are for your health. When analysing debt levels, the balance sheet is the obvious place to start. But ultimately the future profitability of the business will decide if Newmont can strengthen its balance sheet over time. So if you want to see what the professionals think, you might find this free report on analyst profit forecasts to be interesting.
Finally, while the tax-man may adore accounting profits, lenders only accept cold hard cash. So we clearly need to look at whether that EBIT is leading to corresponding free cash flow. Over the last three years, Newmont actually produced more free cash flow than EBIT. There's nothing better than incoming cash when it comes to staying in your lenders' good graces.
Our View
Newmont's EBIT growth rate was a real negative on this analysis, although the other factors we considered were considerably better. There's no doubt that its ability to to convert EBIT to free cash flow is pretty flash. When we consider all the elements mentioned above, it seems to us that Newmont is managing its debt quite well. But a word of caution: we think debt levels are high enough to justify ongoing monitoring. When analysing debt levels, the balance sheet is the obvious place to start. However, not all investment risk resides within the balance sheet - far from it. These risks can be hard to spot. Every company has them, and we've spotted 5 warning signs for Newmont you should know about.
At the end of the day, it's often better to focus on companies that are free from net debt. You can access our special list of such companies (all with a track record of profit growth). It's free.
Valuation is complex, but we're here to simplify it.
Discover if Newmont might be undervalued or overvalued with our detailed analysis, featuring fair value estimates, potential risks, dividends, insider trades, and its financial condition.
Access Free AnalysisHave feedback on this article? Concerned about the content? Get in touch with us directly. Alternatively, email editorial-team (at) simplywallst.com.
This article by Simply Wall St is general in nature. We provide commentary based on historical data and analyst forecasts only using an unbiased methodology and our articles are not intended to be financial advice. It does not constitute a recommendation to buy or sell any stock, and does not take account of your objectives, or your financial situation. We aim to bring you long-term focused analysis driven by fundamental data. Note that our analysis may not factor in the latest price-sensitive company announcements or qualitative material. Simply Wall St has no position in any stocks mentioned.
About NYSE:NEM
Undervalued with excellent balance sheet.
Similar Companies
Market Insights

Advertisement
Community Narratives
The "Molecular Pencil": Why Beam's Technology is Built to Win
Fair Value US$65.01|66.7% undervalued
DA
Community Contributor
The silent giant behind virtually every advanced chip powering AI, smartphones, and modern infrastructure.
Fair Value US$310.00|4.8% undervalued
OS
Community Contributor
ADP Stock: Solid Fundamentals, But AI Investments Test Its Margin Resilience
Fair Value US$387.77|34.5% undervalued
YI
Community Contributor
MINISO's fair value is projected at 26.69 with an anticipated PE ratio shift of 20x
Fair Value US$26.69|18.6% undervalued
BE
Community Contributor