Advertisement
- United States
- /
- Metals and Mining
- /
- NYSE:NEM
Has the Market Priced in Newmont’s 117% Rally and Strategic Expansion?

Simply Wall St
Reviewed by Bailey Pemberton
- Ever wondered if Newmont is a bargain, or if the market’s already caught on to its true value? You’re not alone. There’s a lot of buzz right now around what this gold giant is really worth.
- While the stock dipped 5.7% over the past month, it’s still up a remarkable 117.3% year-to-date and boasts an 88.9% gain over the last year. This suggests that investors’ attitudes toward Newmont’s growth potential have shifted dramatically.
- Recently, Newmont has been in the headlines due to its strategic initiatives and exploration updates, sparking renewed interest among both institutional investors and industry followers. Developments such as expanding operations in promising mining regions and industry mergers have added context to the recent price swings and raised fresh questions about the company’s future trajectory.
- On our valuation scorecard, Newmont comes in at 6 out of 6, indicating an across-the-board undervaluation, at least by traditional checks. Ahead, we will break down what those methods reveal about the stock and preview an even smarter way to size up Newmont’s true worth.
Approach 1: Newmont Discounted Cash Flow (DCF) Analysis
The Discounted Cash Flow (DCF) model estimates a company’s value by projecting its future cash flows and discounting them back to their present value. This approach aims to find what Newmont is worth today based on how much cash it will likely generate in the coming years.
For Newmont, the current Free Cash Flow stands at $5.34 Billion. Analyst forecasts expect Free Cash Flow to grow, reaching $7.56 Billion by 2029. While analyst projections cover the next five years, further estimates stretching out to 2035 are extrapolated to provide a more complete snapshot of long-term potential.
Applying these projections to the DCF model yields an estimated fair value of $115.86 per share for Newmont. At this price, the DCF suggests that Newmont stock is trading at a 28.0% discount to its intrinsic value.
In summary, this analysis indicates that Newmont is significantly undervalued based on its long-term cash flow prospects.
Result: UNDERVALUED
Our Discounted Cash Flow (DCF) analysis suggests Newmont is undervalued by 28.0%. Track this in your watchlist or portfolio, or discover 876 more undervalued stocks based on cash flows.

Approach 2: Newmont Price vs Earnings
For profitable companies like Newmont, the Price-to-Earnings (PE) ratio is a widely accepted valuation tool. It sheds light on how much investors are willing to pay for each dollar of earnings, making it especially useful when a company has consistent profitability. Unlike other metrics, PE directly ties a company’s value to its bottom line.
What counts as a reasonable or "fair" PE ratio often depends on a company’s expected growth, overall risk, profit margins, and how it stacks up against others in its industry. Higher-growth or lower-risk firms usually justify higher PE multiples, while slower growth or greater risks tend to push the ratio lower.
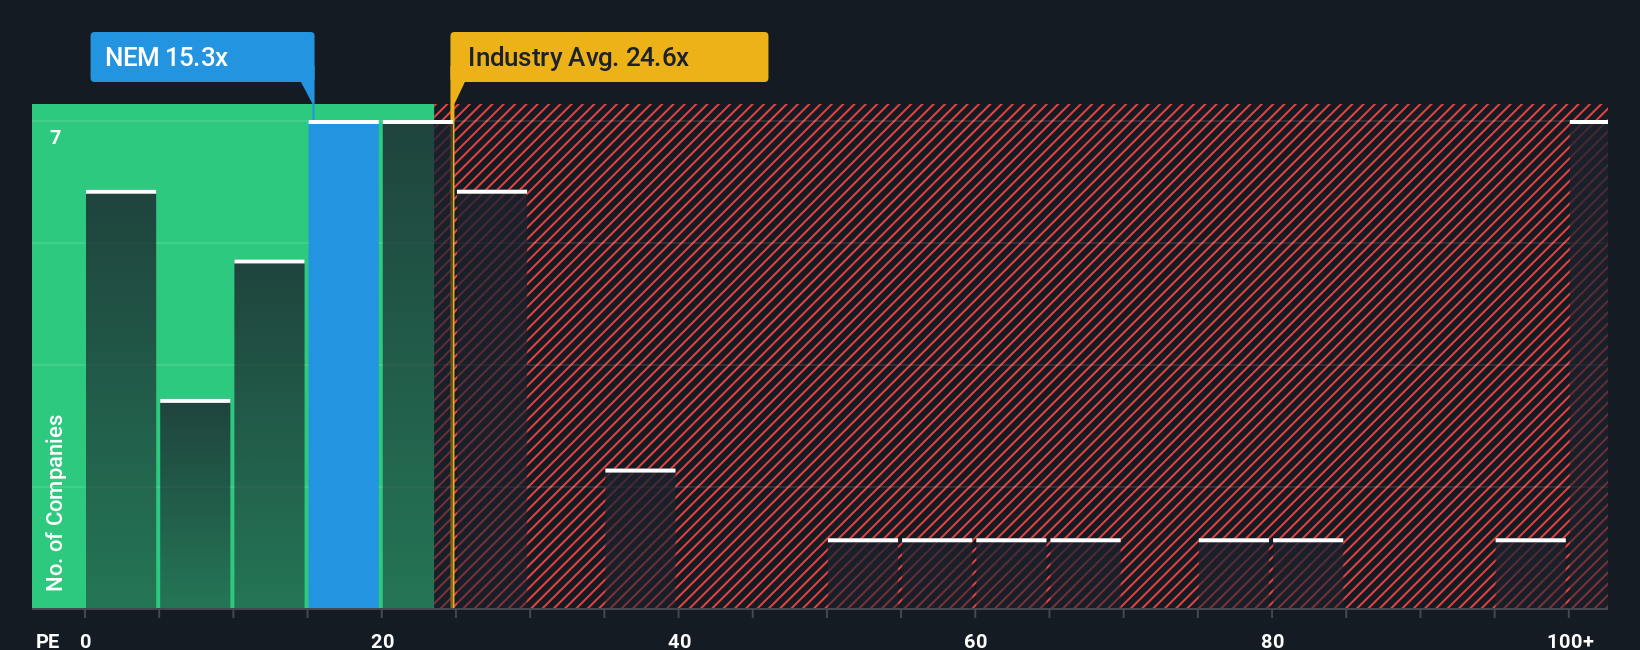
Newmont’s current PE stands at 12.7x, a notable discount compared to the industry average of 21.6x and its peers’ average of 24.2x. This suggests the stock is trading at a lower price relative to earnings than many competitors in the Metals and Mining sector.
Simply Wall St’s Fair Ratio takes this a step further. Instead of just benchmarking against peers or industry averages, the Fair Ratio adjusts for Newmont’s actual growth prospects, profit margins, market cap, and risk profile. This aims to provide a more nuanced view of what the PE multiple "should" be for the company. For Newmont, the Fair Ratio is 22.5x, which is significantly higher than its current multiple.
With Newmont’s PE well below its Fair Ratio, the numbers point to the stock being undervalued based on earnings power, adjusted for its unique characteristics and risk profile.
Result: UNDERVALUED
PE ratios tell one story, but what if the real opportunity lies elsewhere? Discover 1403 companies where insiders are betting big on explosive growth.
Upgrade Your Decision Making: Choose your Newmont Narrative
Earlier we mentioned that there is an even better way to understand valuation. Let’s introduce you to Narratives. A Narrative is a flexible, story-driven approach to investing. It lets you define the “why” behind your investment outlook by connecting your personal perspective on a company’s prospects with financial forecasts and fair value estimates. In other words, Narratives bridge what you believe is happening in Newmont’s business to what that means for its future numbers, then turn those assumptions into a calculated fair value.
With Narratives, accessible on Simply Wall St’s Community page, millions of investors can easily build and share their own views without spreadsheets or complex modeling. Narratives make it simple to see if a stock looks attractive or overpriced by automatically updating your fair value as new news or earnings come in, helping you refine your buy, hold, or sell decisions in real-time.
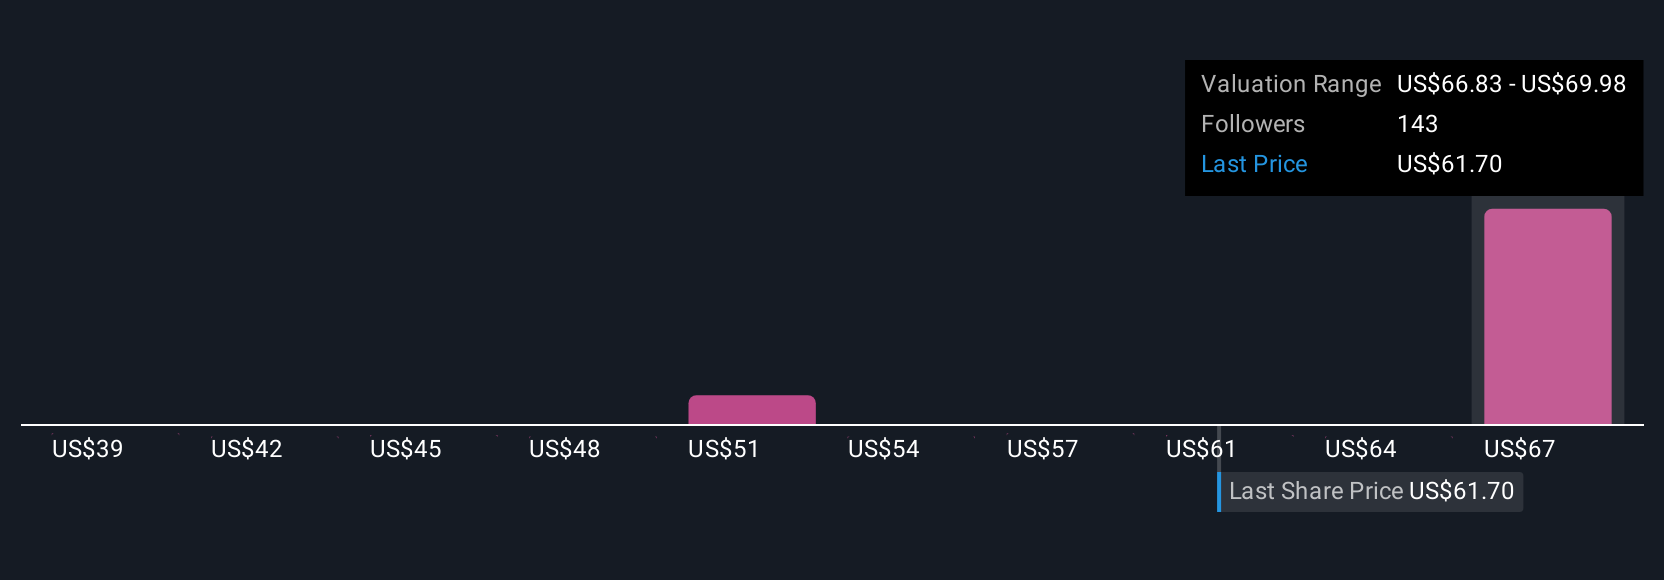
For example, one Newmont Narrative might expect gold prices and operational efficiency to drive earnings higher, justifying a bullish price target above $100 per share. Another might focus on cost risks and forecast future headwinds, supporting a far lower outlook closer to $58. Narratives allow you to choose the path that best matches your convictions and act when the numbers make sense for you.
Do you think there's more to the story for Newmont? Head over to our Community to see what others are saying!
This article by Simply Wall St is general in nature. We provide commentary based on historical data and analyst forecasts only using an unbiased methodology and our articles are not intended to be financial advice. It does not constitute a recommendation to buy or sell any stock, and does not take account of your objectives, or your financial situation. We aim to bring you long-term focused analysis driven by fundamental data. Note that our analysis may not factor in the latest price-sensitive company announcements or qualitative material. Simply Wall St has no position in any stocks mentioned.
Valuation is complex, but we're here to simplify it.
Discover if Newmont might be undervalued or overvalued with our detailed analysis, featuring fair value estimates, potential risks, dividends, insider trades, and its financial condition.
Access Free AnalysisHave feedback on this article? Concerned about the content? Get in touch with us directly. Alternatively, email editorial-team@simplywallst.com
About NYSE:NEM
Very undervalued with excellent balance sheet.
Similar Companies
Market Insights

Advertisement
Community Narratives
The company that turned a verb into a global necessity and basically runs the modern internet, digital ads, smartphones, maps, and AI.
Fair Value US$300.00|7.1% undervalued
OS
Community Contributor
Flowers Foods Pays A Fair Price For Health
Fair Value US$16.12|26.4% undervalued
NV
Community Contributor
TMX Group will thrive with 33.3% profit margin and enduring market moat
Fair Value CA$49.90|0.8% overvalued
LI
Community Contributor
The "Molecular Pencil": Why Beam's Technology is Built to Win
Fair Value US$65.01|65.8% undervalued
DA
Community Contributor