- United States
- /
- Chemicals
- /
- NYSE:EMN
Eastman Chemical (NYSE:EMN) shareholders have earned a 57% return over the last year


If you want to compound wealth in the stock market, you can do so by buying an index fund. But you can significantly boost your returns by picking above-average stocks. For example, the Eastman Chemical Company (NYSE:EMN) share price is up 52% in the last 1 year, clearly besting the market return of around 34% (not including dividends). If it can keep that out-performance up over the long term, investors will do very well! Having said that, the longer term returns aren't so impressive, with stock gaining just 3.0% in three years.
So let's investigate and see if the longer term performance of the company has been in line with the underlying business' progress.
See our latest analysis for Eastman Chemical
In his essay The Superinvestors of Graham-and-Doddsville Warren Buffett described how share prices do not always rationally reflect the value of a business. One flawed but reasonable way to assess how sentiment around a company has changed is to compare the earnings per share (EPS) with the share price.
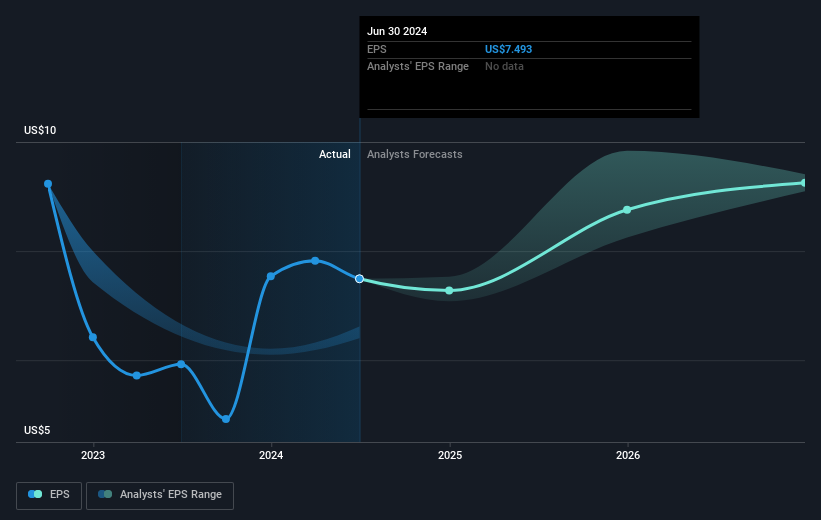
Eastman Chemical was able to grow EPS by 26% in the last twelve months. The share price gain of 52% certainly outpaced the EPS growth. So it's fair to assume the market has a higher opinion of the business than it a year ago.
The graphic below depicts how EPS has changed over time (unveil the exact values by clicking on the image).
It is of course excellent to see how Eastman Chemical has grown profits over the years, but the future is more important for shareholders. You can see how its balance sheet has strengthened (or weakened) over time in this free interactive graphic.
What About Dividends?
It is important to consider the total shareholder return, as well as the share price return, for any given stock. The TSR incorporates the value of any spin-offs or discounted capital raisings, along with any dividends, based on the assumption that the dividends are reinvested. So for companies that pay a generous dividend, the TSR is often a lot higher than the share price return. We note that for Eastman Chemical the TSR over the last 1 year was 57%, which is better than the share price return mentioned above. And there's no prize for guessing that the dividend payments largely explain the divergence!
A Different Perspective
We're pleased to report that Eastman Chemical shareholders have received a total shareholder return of 57% over one year. That's including the dividend. That gain is better than the annual TSR over five years, which is 12%. Therefore it seems like sentiment around the company has been positive lately. In the best case scenario, this may hint at some real business momentum, implying that now could be a great time to delve deeper. It's always interesting to track share price performance over the longer term. But to understand Eastman Chemical better, we need to consider many other factors. For example, we've discovered 2 warning signs for Eastman Chemical that you should be aware of before investing here.
If you like to buy stocks alongside management, then you might just love this free list of companies. (Hint: many of them are unnoticed AND have attractive valuation).
Please note, the market returns quoted in this article reflect the market weighted average returns of stocks that currently trade on American exchanges.
Valuation is complex, but we're here to simplify it.
Discover if Eastman Chemical might be undervalued or overvalued with our detailed analysis, featuring fair value estimates, potential risks, dividends, insider trades, and its financial condition.
Access Free AnalysisHave feedback on this article? Concerned about the content? Get in touch with us directly. Alternatively, email editorial-team (at) simplywallst.com.
This article by Simply Wall St is general in nature. We provide commentary based on historical data and analyst forecasts only using an unbiased methodology and our articles are not intended to be financial advice. It does not constitute a recommendation to buy or sell any stock, and does not take account of your objectives, or your financial situation. We aim to bring you long-term focused analysis driven by fundamental data. Note that our analysis may not factor in the latest price-sensitive company announcements or qualitative material. Simply Wall St has no position in any stocks mentioned.
About NYSE:EMN
Eastman Chemical
Operates as a specialty materials company in the United States, China, and internationally.
Undervalued established dividend payer.
