Advertisement
- United States
- /
- Chemicals
- /
- NYSE:ASH
Does Ashland’s Strategic Overhaul Signal a Turning Point After 31% Share Price Drop?

Simply Wall St
Reviewed by Bailey Pemberton
- Wondering if Ashland stock is a hidden bargain or a value trap? You are not alone, and the answer is more nuanced than headline numbers suggest.
- After a difficult period, Ashland’s shares have dropped 4.4% over the past week and 31.4% year-to-date, fueling speculation about a potential turnaround or deeper risks.
- Recent market chatter has centered around Ashland’s ongoing portfolio adjustments and leadership changes. Both factors could reshape the company’s growth prospects. News of streamlining efforts and strategic acquisitions has added fresh perspectives for investors watching the stock’s volatility.
- When we rate Ashland’s valuation, it scores a 4 out of 6 on our value checklist. This suggests a mix of strengths and weaknesses that are worth a deeper dive. Keep reading as we explore traditional and modern valuation methods and, later, reveal an often-overlooked way to truly understand if Ashland is priced right.
Find out why Ashland's -42.1% return over the last year is lagging behind its peers.
Approach 1: Ashland Discounted Cash Flow (DCF) Analysis
The Discounted Cash Flow (DCF) model estimates a company’s intrinsic value by projecting its future cash flows and discounting them back to their present value. This method helps investors estimate what a company is really worth compared to what the market says.
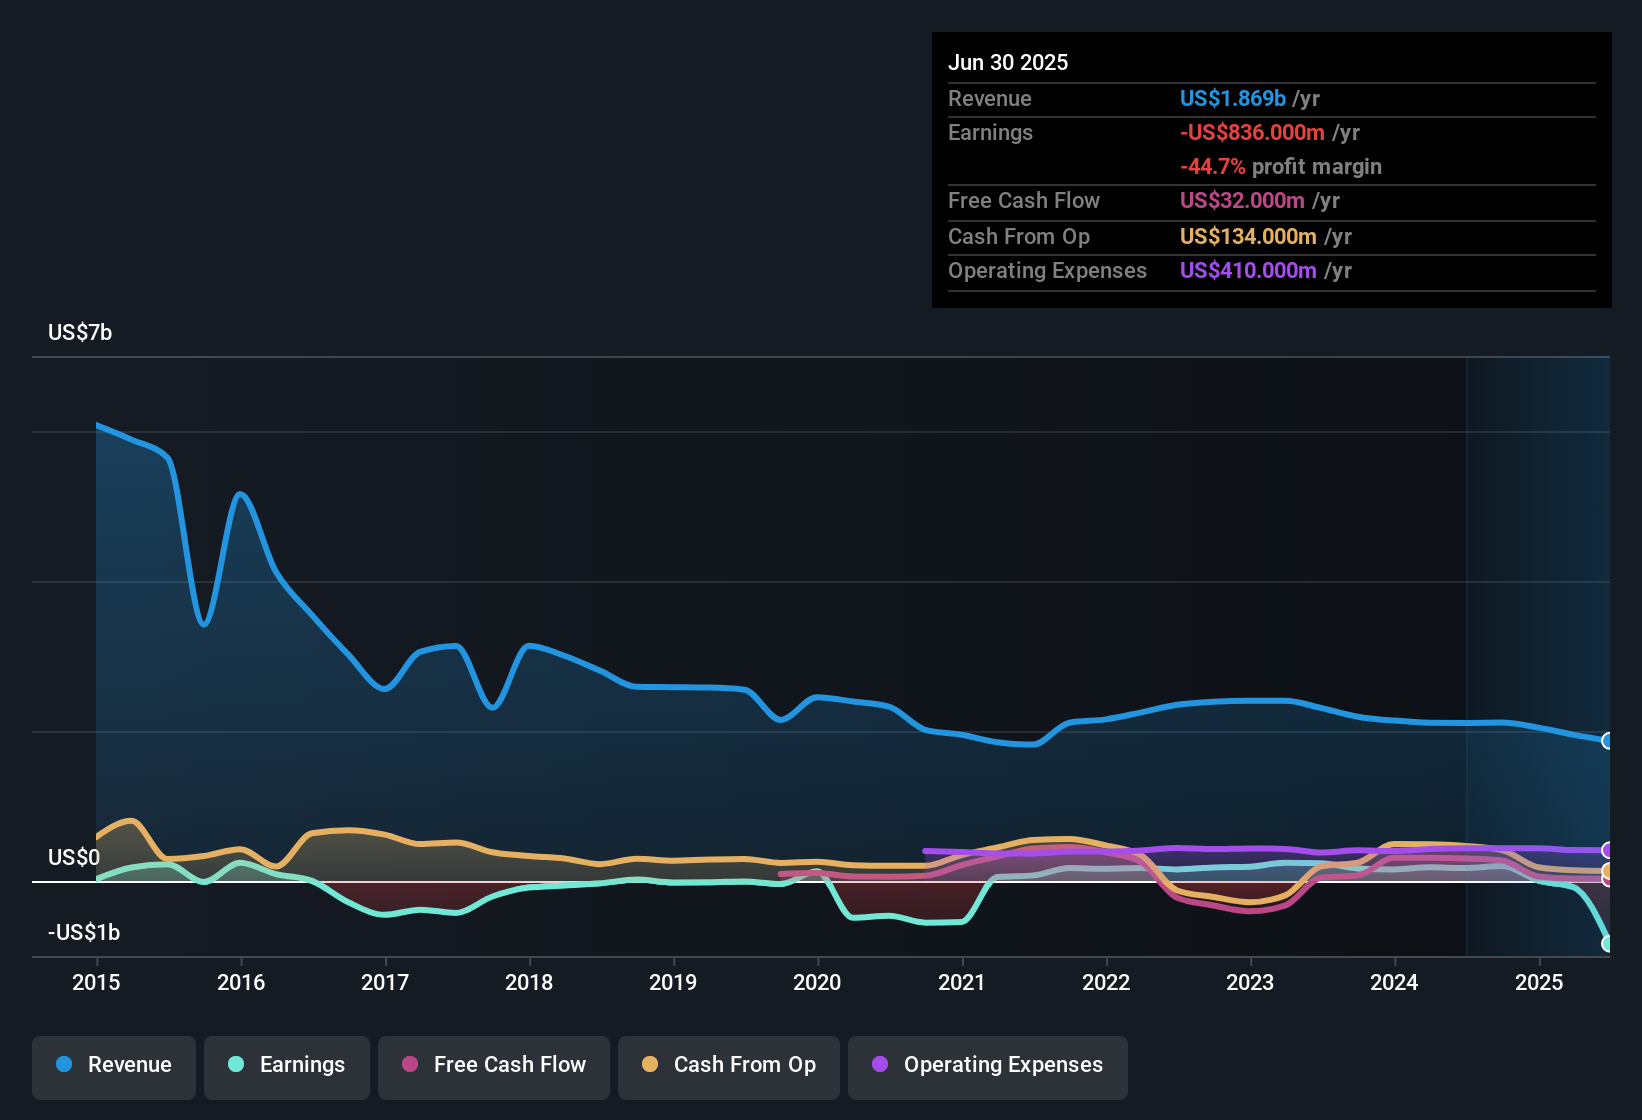
For Ashland, the latest trailing twelve months Free Cash Flow (FCF) stands at $9.96 Million. Analysts have forecasted steady growth in these cash flows, with projections reaching up to $261.67 Million by 2027. Extrapolating further using a two-stage DCF approach, Simply Wall St projects Ashland’s FCF could climb as high as $401.96 Million by 2035.
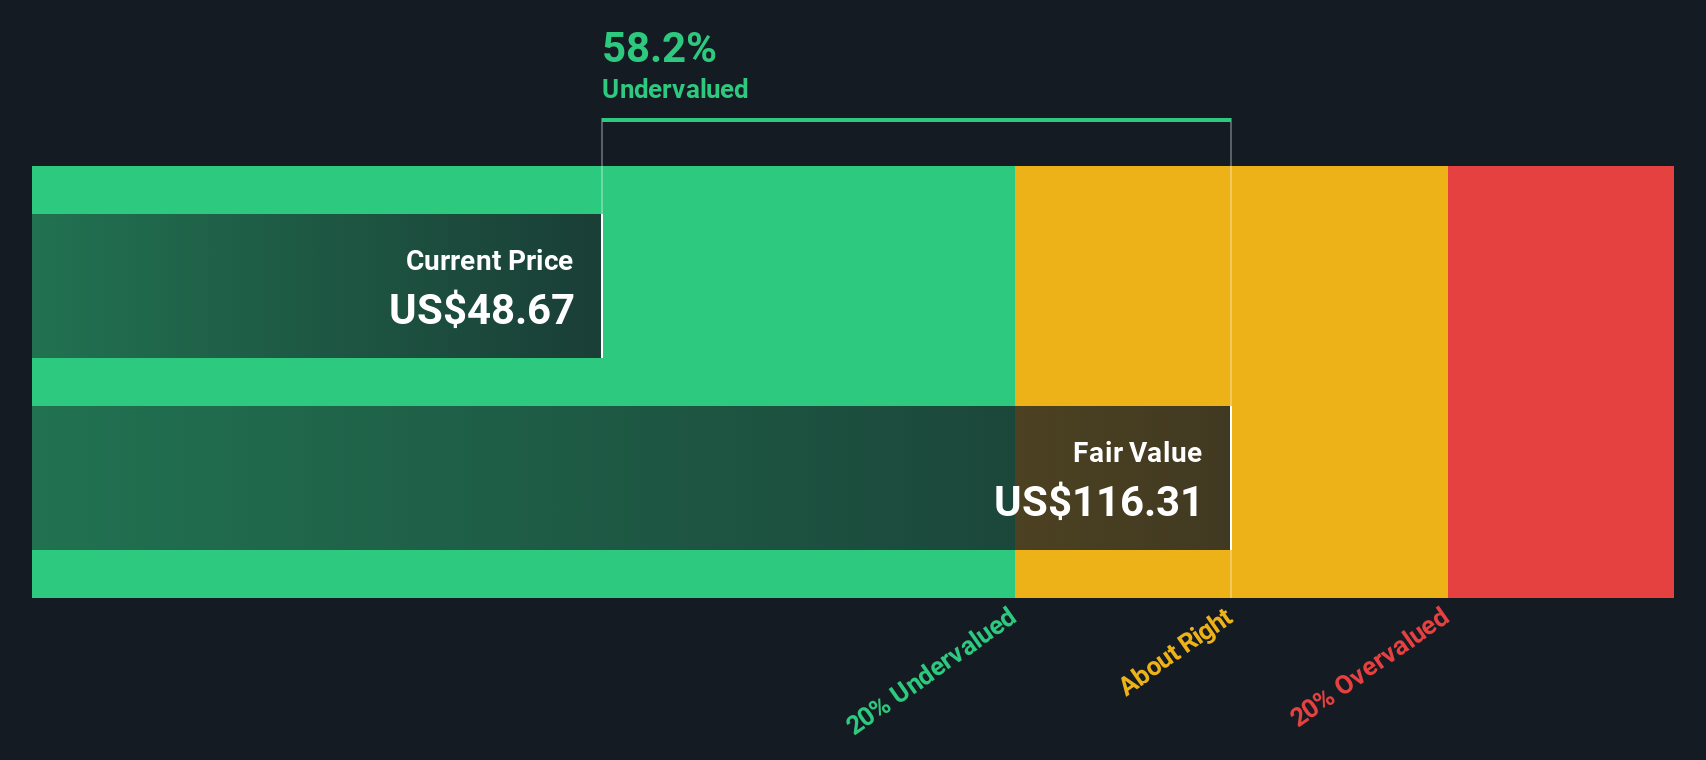
The DCF analysis arrives at a fair value estimate of $119.71 per share. This represents a 60.0% intrinsic discount to the current share price, suggesting the market may have substantially undervalued Ashland based on its future cash-generating potential.
The conclusion is clear: if these projections prove accurate, Ashland shares look significantly undervalued using a DCF lens.
Result: UNDERVALUED
Our Discounted Cash Flow (DCF) analysis suggests Ashland is undervalued by 60.0%. Track this in your watchlist or portfolio, or discover 840 more undervalued stocks based on cash flows.
Approach 2: Ashland Price vs Sales
For companies like Ashland, which may experience volatile or cyclical earnings, the Price-to-Sales (P/S) ratio can be a more suitable valuation tool than earnings-based multiples. The P/S ratio is particularly useful because it smooths out short-term fluctuations and focuses on the company’s ability to generate revenue over time.
It is important to remember that what counts as a "fair" P/S ratio typically depends on expectations for future growth and the risks investors perceive. Fast-growing or highly profitable companies often deserve higher multiples, while riskier or slower-growth businesses usually trade on lower multiples.
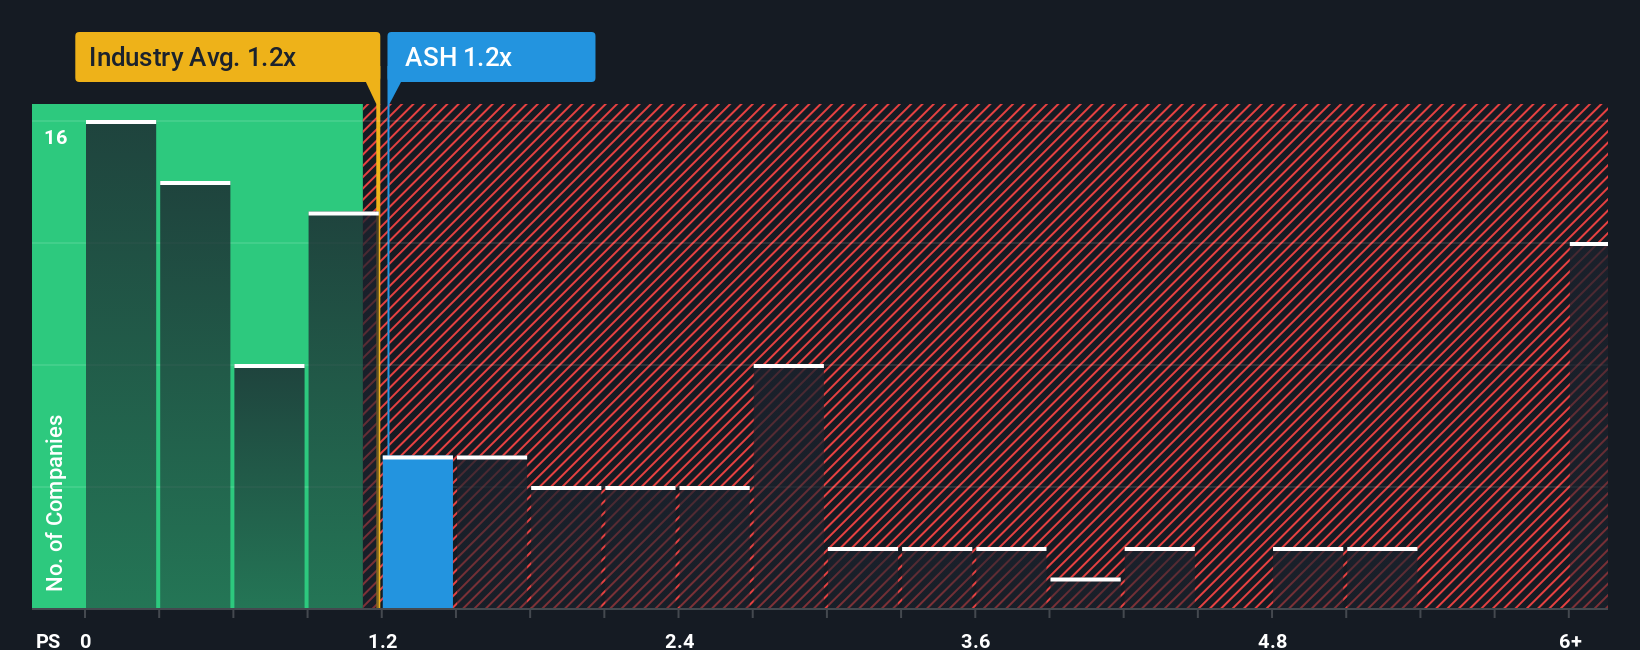
Currently, Ashland trades at 1.17x sales. For comparison, key benchmarks include the chemicals industry average at 1.14x and its peer average at 1.12x. While these numbers seem close, Simply Wall St’s Fair Ratio for Ashland stands at 1.22x sales. This Fair Ratio goes beyond peer and industry comparisons by factoring in Ashland’s projected growth, profit margins, scale, and risks, providing a more tailored assessment of what the company's sales multiple should be.
Comparing Ashland's actual P/S multiple of 1.17x to its Fair Ratio of 1.22x, the difference is quite marginal, suggesting that the stock is fairly valued on this metric.
Result: ABOUT RIGHT
PS ratios tell one story, but what if the real opportunity lies elsewhere? Discover 1411 companies where insiders are betting big on explosive growth.
Upgrade Your Decision Making: Choose your Ashland Narrative
Earlier we mentioned that there's an even better way to understand valuation, so let's introduce you to Narratives. A Narrative is Simply Wall St’s unique approach that helps you build and track an investment “story” based on your personal perspective regarding a company’s future revenue, profits, margins, and fair value.
Unlike traditional ratios or formulas, a Narrative weaves together the story behind the numbers, linking your outlook for a company directly to a dynamic financial forecast and a calculated fair value. Narratives are simple to use and fully accessible on Simply Wall St’s Community page, where millions of investors share, challenge, and refine their views in real time.
This tool empowers you to decide when to buy or sell Ashland by comparing your own estimated Fair Value to the current market price. As new news or earnings data appears, Narratives automatically update, so your forecast always reflects the latest information.
For example, a growth-focused investor might see Ashland’s innovation and cost savings as supporting a fair value as high as $79.0 per share. In contrast, a more cautious investor focused on ongoing risks and margin pressure could justify a fair value closer to $53.0. This serves as a reminder that every investment decision should start with your own Narrative.
Do you think there's more to the story for Ashland? Head over to our Community to see what others are saying!
This article by Simply Wall St is general in nature. We provide commentary based on historical data and analyst forecasts only using an unbiased methodology and our articles are not intended to be financial advice. It does not constitute a recommendation to buy or sell any stock, and does not take account of your objectives, or your financial situation. We aim to bring you long-term focused analysis driven by fundamental data. Note that our analysis may not factor in the latest price-sensitive company announcements or qualitative material. Simply Wall St has no position in any stocks mentioned.
New: Manage All Your Stock Portfolios in One Place
We've created the ultimate portfolio companion for stock investors, and it's free.
• Connect an unlimited number of Portfolios and see your total in one currency
• Be alerted to new Warning Signs or Risks via email or mobile
• Track the Fair Value of your stocks
Have feedback on this article? Concerned about the content? Get in touch with us directly. Alternatively, email editorial-team@simplywallst.com
About NYSE:ASH
Ashland
Provides additives and specialty ingredients in the North and Latin America, Europe, Asia Pacific, and internationally.
Good value with moderate growth potential.
Similar Companies
Market Insights

Advertisement
Community Narratives
The company that turned a verb into a global necessity and basically runs the modern internet, digital ads, smartphones, maps, and AI.
Fair Value US$300.00|7.5% undervalued
OS
Community Contributor
Flowers Foods Pays A Fair Price For Health
Fair Value US$16.12|25.4% undervalued
NV
Community Contributor
TMX Group will thrive with 33.3% profit margin and enduring market moat
Fair Value CA$49.90|3.6% overvalued
LI
Community Contributor
The "Molecular Pencil": Why Beam's Technology is Built to Win
Fair Value US$65.01|65.0% undervalued
DA
Community Contributor