Stock Analysis
- United States
- /
- Chemicals
- /
- NYSE:ASH
Why We’re Not Impressed By Ashland Global Holdings Inc.’s (NYSE:ASH) 3.4% ROCE


Today we are going to look at Ashland Global Holdings Inc. (NYSE:ASH) to see whether it might be an attractive investment prospect. Specifically, we're going to calculate its Return On Capital Employed (ROCE), in the hopes of getting some insight into the business.
Firstly, we'll go over how we calculate ROCE. Second, we'll look at its ROCE compared to similar companies. Then we'll determine how its current liabilities are affecting its ROCE.
Understanding Return On Capital Employed (ROCE)
ROCE is a measure of a company's yearly pre-tax profit (its return), relative to the capital employed in the business. In general, businesses with a higher ROCE are usually better quality. Overall, it is a valuable metric that has its flaws. Author Edwin Whiting says to be careful when comparing the ROCE of different businesses, since 'No two businesses are exactly alike.
So, How Do We Calculate ROCE?
Analysts use this formula to calculate return on capital employed:
Return on Capital Employed = Earnings Before Interest and Tax (EBIT) ÷ (Total Assets - Current Liabilities)
Or for Ashland Global Holdings:
0.034 = US$228m ÷ (US$7.3b - US$688m) (Based on the trailing twelve months to December 2019.)
Therefore, Ashland Global Holdings has an ROCE of 3.4%.
View our latest analysis for Ashland Global Holdings
Is Ashland Global Holdings's ROCE Good?
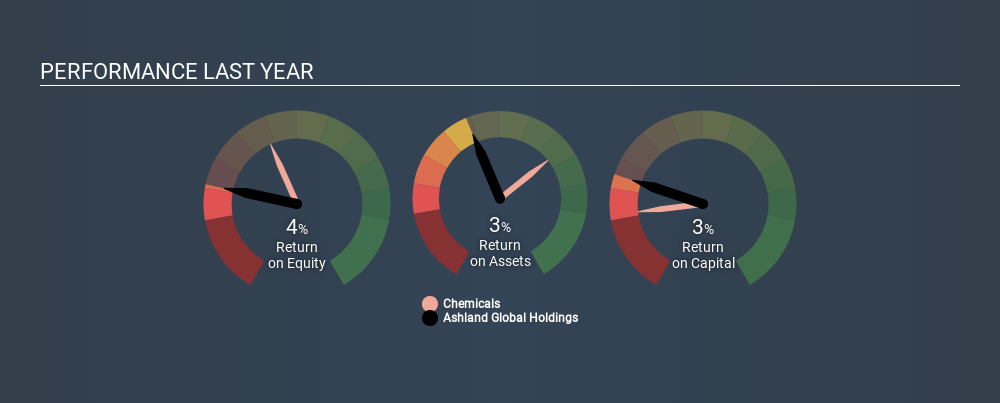
One way to assess ROCE is to compare similar companies. Using our data, Ashland Global Holdings's ROCE appears to be significantly below the 9.0% average in the Chemicals industry. This performance could be negative if sustained, as it suggests the business may underperform its industry. Regardless of how Ashland Global Holdings stacks up against its industry, its ROCE in absolute terms is quite low (especially compared to a bank account). There are potentially more appealing investments elsewhere.
In our analysis, Ashland Global Holdings's ROCE appears to be 3.4%, compared to 3 years ago, when its ROCE was 0.4%. This makes us think about whether the company has been reinvesting shrewdly. You can see in the image below how Ashland Global Holdings's ROCE compares to its industry. Click to see more on past growth.
When considering this metric, keep in mind that it is backwards looking, and not necessarily predictive. ROCE can be misleading for companies in cyclical industries, with returns looking impressive during the boom times, but very weak during the busts. This is because ROCE only looks at one year, instead of considering returns across a whole cycle. Future performance is what matters, and you can see analyst predictions in our free report on analyst forecasts for the company.
Do Ashland Global Holdings's Current Liabilities Skew Its ROCE?
Current liabilities are short term bills and invoices that need to be paid in 12 months or less. Due to the way ROCE is calculated, a high level of current liabilities makes a company look as though it has less capital employed, and thus can (sometimes unfairly) boost the ROCE. To counteract this, we check if a company has high current liabilities, relative to its total assets.
Ashland Global Holdings has current liabilities of US$688m and total assets of US$7.3b. As a result, its current liabilities are equal to approximately 9.4% of its total assets. Ashland Global Holdings has a low level of current liabilities, which have a negligible impact on its already low ROCE.
The Bottom Line On Ashland Global Holdings's ROCE
Nonetheless, there may be better places to invest your capital. Of course, you might find a fantastic investment by looking at a few good candidates. So take a peek at this free list of companies with modest (or no) debt, trading on a P/E below 20.
If you like to buy stocks alongside management, then you might just love this free list of companies. (Hint: insiders have been buying them).
If you spot an error that warrants correction, please contact the editor at editorial-team@simplywallst.com. This article by Simply Wall St is general in nature. It does not constitute a recommendation to buy or sell any stock, and does not take account of your objectives, or your financial situation. Simply Wall St has no position in the stocks mentioned.
We aim to bring you long-term focused research analysis driven by fundamental data. Note that our analysis may not factor in the latest price-sensitive company announcements or qualitative material. Thank you for reading.
About NYSE:ASH
Ashland
Provides additives and specialty ingredients in the North and Latin America, Europe, Asia Pacific, and internationally.
Adequate balance sheet average dividend payer.
