Stock Analysis
- United States
- /
- Metals and Mining
- /
- NasdaqGS:STLD
Steel Dynamics' (NASDAQ:STLD) earnings growth rate lags the 36% CAGR delivered to shareholders

We think all investors should try to buy and hold high quality multi-year winners. While the best companies are hard to find, but they can generate massive returns over long periods. Just think about the savvy investors who held Steel Dynamics, Inc. (NASDAQ:STLD) shares for the last five years, while they gained 313%. This just goes to show the value creation that some businesses can achieve. It's also good to see the share price up 12% over the last quarter. The company reported its financial results recently; you can catch up on the latest numbers by reading our company report.
Since the long term performance has been good but there's been a recent pullback of 6.5%, let's check if the fundamentals match the share price.
See our latest analysis for Steel Dynamics
To quote Buffett, 'Ships will sail around the world but the Flat Earth Society will flourish. There will continue to be wide discrepancies between price and value in the marketplace...' One imperfect but simple way to consider how the market perception of a company has shifted is to compare the change in the earnings per share (EPS) with the share price movement.
During five years of share price growth, Steel Dynamics achieved compound earnings per share (EPS) growth of 23% per year. This EPS growth is slower than the share price growth of 33% per year, over the same period. This suggests that market participants hold the company in higher regard, these days. And that's hardly shocking given the track record of growth.
You can see below how EPS has changed over time (discover the exact values by clicking on the image).
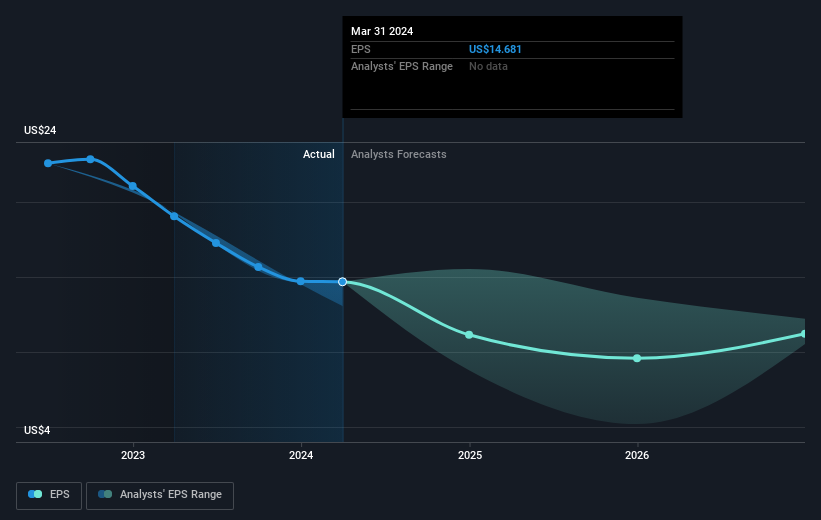
It is of course excellent to see how Steel Dynamics has grown profits over the years, but the future is more important for shareholders. You can see how its balance sheet has strengthened (or weakened) over time in this free interactive graphic.
What About Dividends?
It is important to consider the total shareholder return, as well as the share price return, for any given stock. The TSR is a return calculation that accounts for the value of cash dividends (assuming that any dividend received was reinvested) and the calculated value of any discounted capital raisings and spin-offs. Arguably, the TSR gives a more comprehensive picture of the return generated by a stock. As it happens, Steel Dynamics' TSR for the last 5 years was 363%, which exceeds the share price return mentioned earlier. This is largely a result of its dividend payments!
A Different Perspective
Steel Dynamics provided a TSR of 29% over the year (including dividends). That's fairly close to the broader market return. It has to be noted that the recent return falls short of the 36% shareholders have gained each year, over half a decade. Although the share price growth has slowed, the longer term story points to a business well worth watching. I find it very interesting to look at share price over the long term as a proxy for business performance. But to truly gain insight, we need to consider other information, too. To that end, you should be aware of the 1 warning sign we've spotted with Steel Dynamics .
If you would prefer to check out another company -- one with potentially superior financials -- then do not miss this free list of companies that have proven they can grow earnings.
Please note, the market returns quoted in this article reflect the market weighted average returns of stocks that currently trade on American exchanges.
Valuation is complex, but we're helping make it simple.
Find out whether Steel Dynamics is potentially over or undervalued by checking out our comprehensive analysis, which includes fair value estimates, risks and warnings, dividends, insider transactions and financial health.
View the Free AnalysisHave feedback on this article? Concerned about the content? Get in touch with us directly. Alternatively, email editorial-team (at) simplywallst.com.
This article by Simply Wall St is general in nature. We provide commentary based on historical data and analyst forecasts only using an unbiased methodology and our articles are not intended to be financial advice. It does not constitute a recommendation to buy or sell any stock, and does not take account of your objectives, or your financial situation. We aim to bring you long-term focused analysis driven by fundamental data. Note that our analysis may not factor in the latest price-sensitive company announcements or qualitative material. Simply Wall St has no position in any stocks mentioned.
About NasdaqGS:STLD
Steel Dynamics
Steel Dynamics, Inc., together with its subsidiaries, operates as a steel producer and metal recycler in the United States.
Flawless balance sheet average dividend payer.
