
Advertisement
Howard Marks put it nicely when he said that, rather than worrying about share price volatility, 'The possibility of permanent loss is the risk I worry about... and every practical investor I know worries about.' It's only natural to consider a company's balance sheet when you examine how risky it is, since debt is often involved when a business collapses. We note that Hawkins, Inc. (NASDAQ:HWKN) does have debt on its balance sheet. But is this debt a concern to shareholders?
What Risk Does Debt Bring?
Debt is a tool to help businesses grow, but if a business is incapable of paying off its lenders, then it exists at their mercy. If things get really bad, the lenders can take control of the business. However, a more frequent (but still costly) occurrence is where a company must issue shares at bargain-basement prices, permanently diluting shareholders, just to shore up its balance sheet. Of course, plenty of companies use debt to fund growth, without any negative consequences. When we think about a company's use of debt, we first look at cash and debt together.
Check out our latest analysis for Hawkins
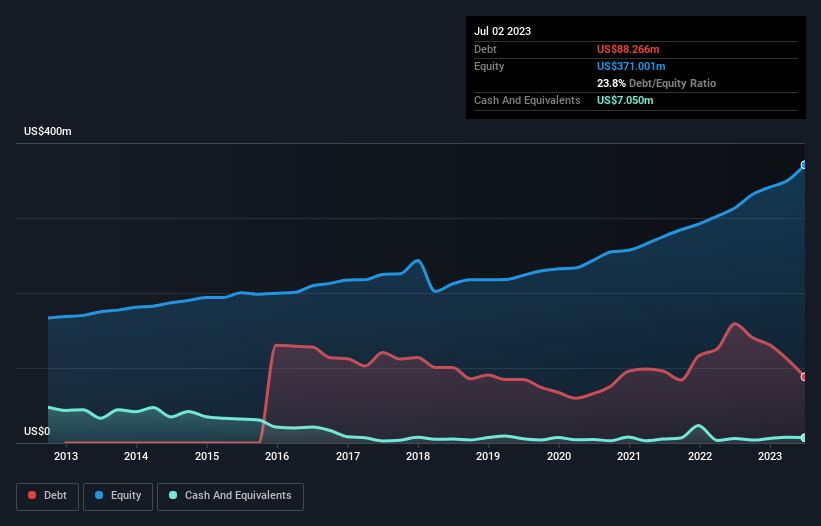
How Much Debt Does Hawkins Carry?
As you can see below, Hawkins had US$88.3m of debt at July 2023, down from US$159.1m a year prior. However, it does have US$7.05m in cash offsetting this, leading to net debt of about US$81.2m.
How Strong Is Hawkins' Balance Sheet?
Zooming in on the latest balance sheet data, we can see that Hawkins had liabilities of US$94.3m due within 12 months and liabilities of US$126.7m due beyond that. On the other hand, it had cash of US$7.05m and US$138.3m worth of receivables due within a year. So its liabilities outweigh the sum of its cash and (near-term) receivables by US$75.6m.
Since publicly traded Hawkins shares are worth a total of US$1.24b, it seems unlikely that this level of liabilities would be a major threat. Having said that, it's clear that we should continue to monitor its balance sheet, lest it change for the worse.
In order to size up a company's debt relative to its earnings, we calculate its net debt divided by its earnings before interest, tax, depreciation, and amortization (EBITDA) and its earnings before interest and tax (EBIT) divided by its interest expense (its interest cover). The advantage of this approach is that we take into account both the absolute quantum of debt (with net debt to EBITDA) and the actual interest expenses associated with that debt (with its interest cover ratio).
Hawkins's net debt is only 0.69 times its EBITDA. And its EBIT covers its interest expense a whopping 16.5 times over. So we're pretty relaxed about its super-conservative use of debt. Also good is that Hawkins grew its EBIT at 17% over the last year, further increasing its ability to manage debt. The balance sheet is clearly the area to focus on when you are analysing debt. But ultimately the future profitability of the business will decide if Hawkins can strengthen its balance sheet over time. So if you're focused on the future you can check out this free report showing analyst profit forecasts.
Finally, a company can only pay off debt with cold hard cash, not accounting profits. So it's worth checking how much of that EBIT is backed by free cash flow. In the last three years, Hawkins's free cash flow amounted to 43% of its EBIT, less than we'd expect. That's not great, when it comes to paying down debt.
Our View
Hawkins's interest cover suggests it can handle its debt as easily as Cristiano Ronaldo could score a goal against an under 14's goalkeeper. And the good news does not stop there, as its net debt to EBITDA also supports that impression! When we consider the range of factors above, it looks like Hawkins is pretty sensible with its use of debt. That means they are taking on a bit more risk, in the hope of boosting shareholder returns. Over time, share prices tend to follow earnings per share, so if you're interested in Hawkins, you may well want to click here to check an interactive graph of its earnings per share history.
Of course, if you're the type of investor who prefers buying stocks without the burden of debt, then don't hesitate to discover our exclusive list of net cash growth stocks, today.
Valuation is complex, but we're here to simplify it.
Discover if Hawkins might be undervalued or overvalued with our detailed analysis, featuring fair value estimates, potential risks, dividends, insider trades, and its financial condition.
Access Free AnalysisHave feedback on this article? Concerned about the content? Get in touch with us directly. Alternatively, email editorial-team (at) simplywallst.com.
This article by Simply Wall St is general in nature. We provide commentary based on historical data and analyst forecasts only using an unbiased methodology and our articles are not intended to be financial advice. It does not constitute a recommendation to buy or sell any stock, and does not take account of your objectives, or your financial situation. We aim to bring you long-term focused analysis driven by fundamental data. Note that our analysis may not factor in the latest price-sensitive company announcements or qualitative material. Simply Wall St has no position in any stocks mentioned.
About NasdaqGS:HWKN
Hawkins
Operates as a water treatment and specialty ingredients company in the United States.
Acceptable track record with mediocre balance sheet.
Similar Companies
Market Insights

Advertisement
Community Narratives
MicroVision will explode future revenue by 380.37% with a vision towards success
Fair Value US$60|98.4% undervalued
TH
Community Contributor
The Indispensable Artery for a New North American Economy
Fair Value CA$132.87|3.6% undervalued
TI
Community Contributor
Recently Updated Narratives
BE


Bejgal on MINISO Group Holding ·
MINISO's fair value is projected at 26.69 with an anticipated PE ratio shift of 20x
Fair Value:US$26.6927.9% undervalued
44 followersusers have followed this narrative
3 commentsusers have commented on this narrative
0 likesusers have liked this narrative
TI


TickerTickle on Oracle ·
The Quiet Giant That Became AI’s Power Grid
Fair Value:US$389.8148.6% undervalued
6 followersusers have followed this narrative
0 commentsusers have commented on this narrative
0 likesusers have liked this narrative
AU

AuCA on Nova Ljubljanska Banka d.d ·
Nova Ljubljanska Banka d.d will expect a 11.2% revenue boost driving future growth
Fair Value:€20916.3% undervalued
23 followersusers have followed this narrative
3 commentsusers have commented on this narrative
0 likesusers have liked this narrative
Popular Narratives
OS


oscargarcia on Alphabet ·
The company that turned a verb into a global necessity and basically runs the modern internet, digital ads, smartphones, maps, and AI.
Fair Value:US$3406.3% undervalued
130 followersusers have followed this narrative
6 commentsusers have commented on this narrative
17 likesusers have liked this narrative
TH

TheWallstreetKing on MicroVision ·
MicroVision will explode future revenue by 380.37% with a vision towards success
Fair Value:US$6098.4% undervalued
81 followersusers have followed this narrative
10 commentsusers have commented on this narrative
18 likesusers have liked this narrative
AN


AnalystConsensusTarget on NVIDIA ·
NVDA: Expanding AI Demand Will Drive Major Data Center Investments Through 2026
Fair Value:US$232.7921.6% undervalued
918 followersusers have followed this narrative
5 commentsusers have commented on this narrative
21 likesusers have liked this narrative