- United States
- /
- Insurance
- /
- NYSE:RNR
RenaissanceRe Holdings (NYSE:RNR) shareholders have earned a 14% CAGR over the last three years


By buying an index fund, investors can approximate the average market return. But if you buy good businesses at attractive prices, your portfolio returns could exceed the average market return. For example, the RenaissanceRe Holdings Ltd. (NYSE:RNR) share price is up 46% in the last three years, clearly besting the market return of around 15% (not including dividends). On the other hand, the returns haven't been quite so good recently, with shareholders up just 35%, including dividends.
With that in mind, it's worth seeing if the company's underlying fundamentals have been the driver of long term performance, or if there are some discrepancies.
See our latest analysis for RenaissanceRe Holdings
While the efficient markets hypothesis continues to be taught by some, it has been proven that markets are over-reactive dynamic systems, and investors are not always rational. One imperfect but simple way to consider how the market perception of a company has shifted is to compare the change in the earnings per share (EPS) with the share price movement.
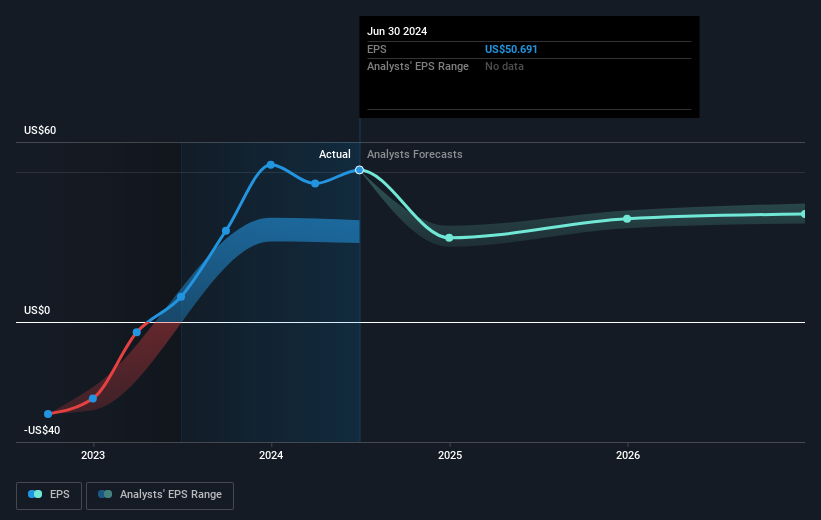
During three years of share price growth, RenaissanceRe Holdings achieved compound earnings per share growth of 83% per year. The average annual share price increase of 13% is actually lower than the EPS growth. So it seems investors have become more cautious about the company, over time. We'd venture the lowish P/E ratio of 4.81 also reflects the negative sentiment around the stock.
The graphic below depicts how EPS has changed over time (unveil the exact values by clicking on the image).
We know that RenaissanceRe Holdings has improved its bottom line over the last three years, but what does the future have in store? If you are thinking of buying or selling RenaissanceRe Holdings stock, you should check out this FREE detailed report on its balance sheet.
What About Dividends?
As well as measuring the share price return, investors should also consider the total shareholder return (TSR). Whereas the share price return only reflects the change in the share price, the TSR includes the value of dividends (assuming they were reinvested) and the benefit of any discounted capital raising or spin-off. So for companies that pay a generous dividend, the TSR is often a lot higher than the share price return. As it happens, RenaissanceRe Holdings' TSR for the last 3 years was 50%, which exceeds the share price return mentioned earlier. This is largely a result of its dividend payments!
A Different Perspective
It's good to see that RenaissanceRe Holdings has rewarded shareholders with a total shareholder return of 35% in the last twelve months. Of course, that includes the dividend. That's better than the annualised return of 6% over half a decade, implying that the company is doing better recently. In the best case scenario, this may hint at some real business momentum, implying that now could be a great time to delve deeper. It's always interesting to track share price performance over the longer term. But to understand RenaissanceRe Holdings better, we need to consider many other factors. For example, we've discovered 1 warning sign for RenaissanceRe Holdings that you should be aware of before investing here.
Of course, you might find a fantastic investment by looking elsewhere. So take a peek at this free list of companies we expect will grow earnings.
Please note, the market returns quoted in this article reflect the market weighted average returns of stocks that currently trade on American exchanges.
New: AI Stock Screener & Alerts
Our new AI Stock Screener scans the market every day to uncover opportunities.
• Dividend Powerhouses (3%+ Yield)
• Undervalued Small Caps with Insider Buying
• High growth Tech and AI Companies
Or build your own from over 50 metrics.
Have feedback on this article? Concerned about the content? Get in touch with us directly. Alternatively, email editorial-team (at) simplywallst.com.
This article by Simply Wall St is general in nature. We provide commentary based on historical data and analyst forecasts only using an unbiased methodology and our articles are not intended to be financial advice. It does not constitute a recommendation to buy or sell any stock, and does not take account of your objectives, or your financial situation. We aim to bring you long-term focused analysis driven by fundamental data. Note that our analysis may not factor in the latest price-sensitive company announcements or qualitative material. Simply Wall St has no position in any stocks mentioned.
About NYSE:RNR
RenaissanceRe Holdings
Provides reinsurance and insurance products in the United States and internationally.
Outstanding track record with flawless balance sheet.
