- United States
- /
- Insurance
- /
- NYSE:RGA
Investors in Reinsurance Group of America (NYSE:RGA) have seen splendid returns of 109% over the past three years


One simple way to benefit from the stock market is to buy an index fund. But if you pick the right individual stocks, you could make more than that. For example, the Reinsurance Group of America, Incorporated (NYSE:RGA) share price is up 95% in the last three years, clearly besting the market return of around 15% (not including dividends). However, more recent returns haven't been as impressive as that, with the stock returning just 50% in the last year, including dividends.
With that in mind, it's worth seeing if the company's underlying fundamentals have been the driver of long term performance, or if there are some discrepancies.
View our latest analysis for Reinsurance Group of America
While the efficient markets hypothesis continues to be taught by some, it has been proven that markets are over-reactive dynamic systems, and investors are not always rational. One way to examine how market sentiment has changed over time is to look at the interaction between a company's share price and its earnings per share (EPS).
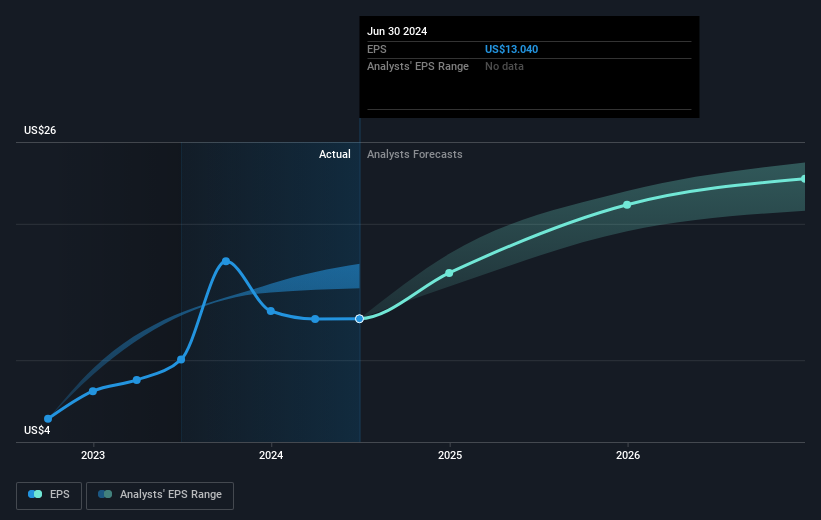
Reinsurance Group of America was able to grow its EPS at 2.2% per year over three years, sending the share price higher. In comparison, the 25% per year gain in the share price outpaces the EPS growth. This suggests that, as the business progressed over the last few years, it gained the confidence of market participants. It's not unusual to see the market 're-rate' a stock, after a few years of growth.
You can see how EPS has changed over time in the image below (click on the chart to see the exact values).
We're pleased to report that the CEO is remunerated more modestly than most CEOs at similarly capitalized companies. It's always worth keeping an eye on CEO pay, but a more important question is whether the company will grow earnings throughout the years. This free interactive report on Reinsurance Group of America's earnings, revenue and cash flow is a great place to start, if you want to investigate the stock further.
What About Dividends?
When looking at investment returns, it is important to consider the difference between total shareholder return (TSR) and share price return. The TSR is a return calculation that accounts for the value of cash dividends (assuming that any dividend received was reinvested) and the calculated value of any discounted capital raisings and spin-offs. It's fair to say that the TSR gives a more complete picture for stocks that pay a dividend. We note that for Reinsurance Group of America the TSR over the last 3 years was 109%, which is better than the share price return mentioned above. And there's no prize for guessing that the dividend payments largely explain the divergence!
A Different Perspective
We're pleased to report that Reinsurance Group of America shareholders have received a total shareholder return of 50% over one year. Of course, that includes the dividend. Since the one-year TSR is better than the five-year TSR (the latter coming in at 9% per year), it would seem that the stock's performance has improved in recent times. Someone with an optimistic perspective could view the recent improvement in TSR as indicating that the business itself is getting better with time. Before spending more time on Reinsurance Group of America it might be wise to click here to see if insiders have been buying or selling shares.
Of course Reinsurance Group of America may not be the best stock to buy. So you may wish to see this free collection of growth stocks.
Please note, the market returns quoted in this article reflect the market weighted average returns of stocks that currently trade on American exchanges.
New: AI Stock Screener & Alerts
Our new AI Stock Screener scans the market every day to uncover opportunities.
• Dividend Powerhouses (3%+ Yield)
• Undervalued Small Caps with Insider Buying
• High growth Tech and AI Companies
Or build your own from over 50 metrics.
Have feedback on this article? Concerned about the content? Get in touch with us directly. Alternatively, email editorial-team (at) simplywallst.com.
This article by Simply Wall St is general in nature. We provide commentary based on historical data and analyst forecasts only using an unbiased methodology and our articles are not intended to be financial advice. It does not constitute a recommendation to buy or sell any stock, and does not take account of your objectives, or your financial situation. We aim to bring you long-term focused analysis driven by fundamental data. Note that our analysis may not factor in the latest price-sensitive company announcements or qualitative material. Simply Wall St has no position in any stocks mentioned.
About NYSE:RGA
Solid track record established dividend payer.

