Genworth Financial (GNW) shares saw limited movement in recent trading, catching the attention of investors curious about its longer-term trends. While the headline numbers did not drive major activity, the stock’s performance over the past year has steadily climbed.
Genworth Financial’s share price has held its ground in recent months, fueled by a solid year-to-date share price return of nearly 23%. The company’s 20% one-year total shareholder return and impressive 91% gain over three years highlight growing investor confidence and a positive longer-term trend.
The real question now is whether Genworth Financial remains a bargain amid its recent gains, or if the current price already reflects all the expected growth ahead and leaves little room for upside.
Advertisement
Price-to-Earnings of 16.8x: Is it justified?
Genworth Financial trades at a price-to-earnings (P/E) ratio of 16.8x, placing its current valuation slightly below the overall US market P/E of 18.1x and meaningfully higher than its direct insurance industry peers.
The price-to-earnings ratio tells us how much investors are willing to pay for each dollar of the company’s earnings. For insurers, this metric helps gauge whether the market sees the business as a growth play or a value proposition, since earnings can be volatile but ultimately drive shareholder returns.
At 16.8x, Genworth’s P/E suggests some optimism compared to the wider insurance sector average of 13.7x and a notable premium to its peer average of 8.9x. This elevated multiple could reflect investor confidence in recent profit rebounds. However, it also means the stock is not a deep value play compared to its industry.
With no fair ratio benchmark available, it is important to dig deeper into what is driving this premium and whether the current share price leaves room for further upside or not.
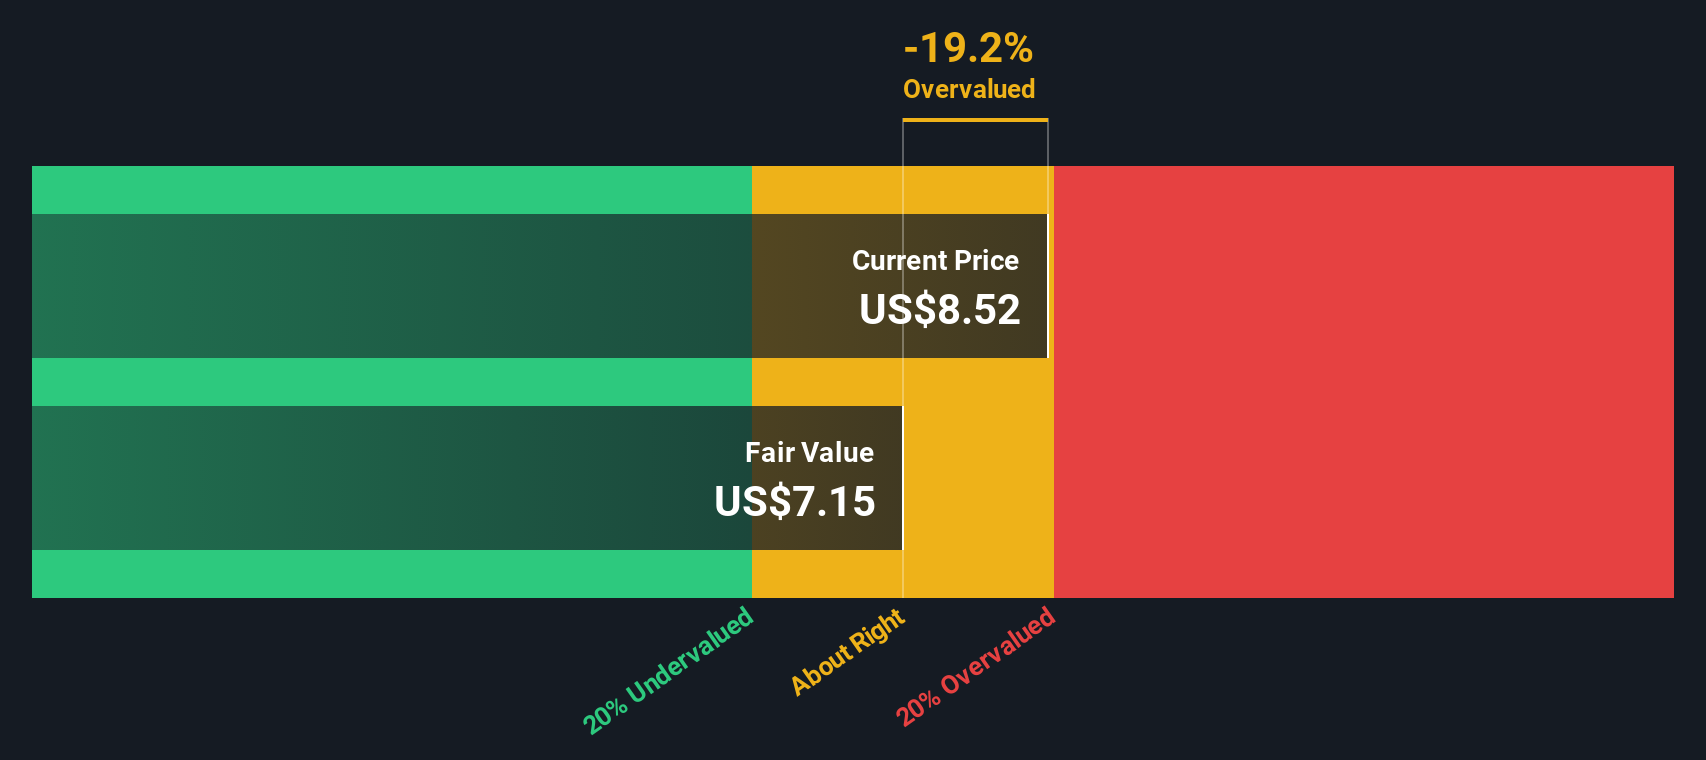
While the price-to-earnings ratio suggests that Genworth Financial is more expensive than its industry peers, our SWS DCF model uses a different approach by focusing on the company's future cash flows. According to this method, Genworth appears overvalued, with the share price trading above our estimate of fair value.
With these two different valuation methods offering conflicting signals, the question is whether Genworth holds hidden value that others are overlooking or if investors are dismissing important warning signs. The answer may depend on which valuation perspective you prioritize.
If you’d rather take the reins and investigate the numbers yourself, building a personal view is always an option and only takes a few minutes. Do it your way
A great starting point for your Genworth Financial research is our analysis highlighting 2 key rewards and 2 important warning signs that could impact your investment decision.
Looking for More Investment Ideas?
Smart investors keep their radar tuned for tomorrow’s opportunities. Don’t wait for headlines to reveal what you could uncover now with powerful screening tools at your fingertips.
Capture rising dividends and enjoy steady income by checking out these 20 dividend stocks with yields > 3%, which offers yields above 3% from robust companies with solid payout histories.
Harness the potential of future tech breakthroughs and stay ahead of the curve with these 27 quantum computing stocks, which shapes advances in computing and innovation.
This article by Simply Wall St is general in nature. We provide commentary based on historical data
and analyst forecasts only using an unbiased methodology and our articles are not intended to be financial advice. It does not constitute a recommendation to buy or sell any stock, and does not take account of your objectives, or your
financial situation. We aim to bring you long-term focused analysis driven by fundamental data.
Note that our analysis may not factor in the latest price-sensitive company announcements or qualitative material.
Simply Wall St has no position in any stocks mentioned.
New: Manage All Your Stock Portfolios in One Place
We've created the ultimate portfolio companion for stock investors, and it's free.
• Connect an unlimited number of Portfolios and see your total in one currency • Be alerted to new Warning Signs or Risks via email or mobile • Track the Fair Value of your stocks