Advertisement
- United States
- /
- Insurance
- /
- NYSE:AFL
Does Aflac’s Digital Expansion Signal Room for Growth After 11.5% Year-to-Date Rally?

Simply Wall St
Reviewed by Bailey Pemberton
- Ever wondered if Aflac’s current share price actually matches up to its true worth, or if there’s untapped value hidden beneath the headline numbers?
- After a healthy jump of 6.4% in the past week, Aflac is up 2.8% this month and has soared 11.5% year-to-date, with long-term gains reaching an impressive 209.1% over five years.
- Recently, Aflac made headlines with its expansion into new insurance markets and investments in digital technology. This reflects the company’s push to modernize and find fresh sources of growth. These moves have caught investors’ attention, sparking conversations around shifting opportunities and risk profiles.
- On a scale of 6, Aflac clocks in with a valuation score of 2. This tells only part of the story, as different models give different answers. By the end of this article, you’ll have a smarter, more holistic approach to valuing the stock.
Aflac scores just 2/6 on our valuation checks. See what other red flags we found in the full valuation breakdown.
Approach 1: Aflac Excess Returns Analysis
The Excess Returns model centers on how effectively a company generates returns on its invested capital above its cost of equity. For Aflac, this approach shines a light on fundamental business strength rather than flashy growth or volatile market moods.
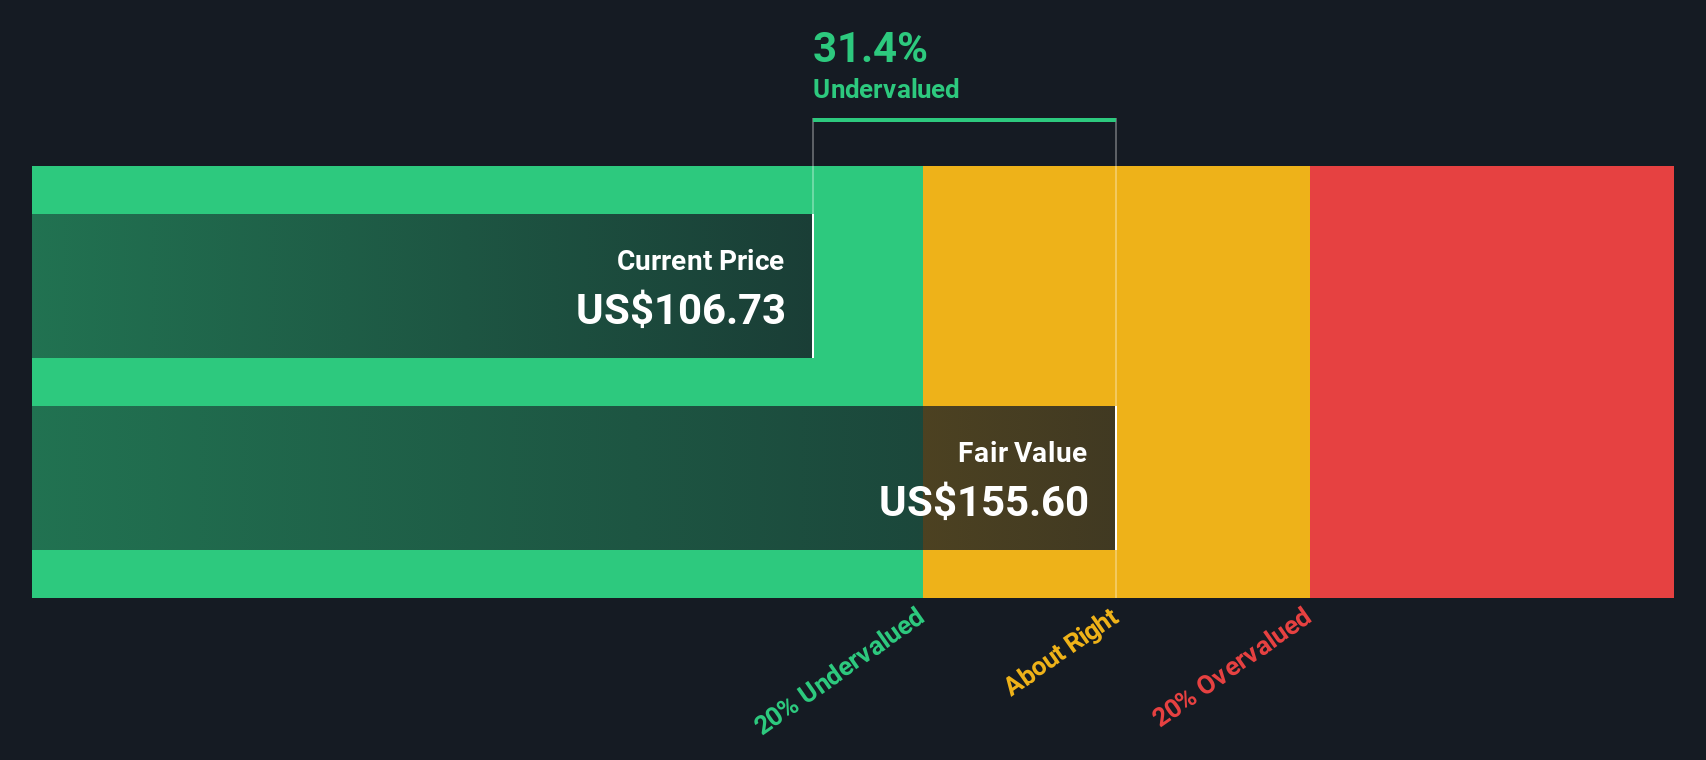
Aflac reports a book value of $54.57 per share and a stable earnings-per-share (EPS) estimate of $7.85, derived from analyst consensus on future Return on Equity. The company's average Return on Equity stands at a solid 14.19%, outpacing its cost of equity of $3.85 per share. This creates an excess return of $4.00 per share, demonstrating Aflac’s knack for turning shareholder investments into consistent profit. Analysts project the stable book value to hold around $55.33 per share in coming periods.
Given these metrics, the model estimates an intrinsic value of $163.61 per share for Aflac. Compared to the company’s current share price, this means the stock is trading at a discount of approximately 30.3%. In other words, according to the Excess Returns framework, Aflac’s fundamentals support a much higher price than what the market currently reflects.
Result: UNDERVALUED
Our Excess Returns analysis suggests Aflac is undervalued by 30.3%. Track this in your watchlist or portfolio, or discover 875 more undervalued stocks based on cash flows.
Approach 2: Aflac Price vs Earnings
The Price-to-Earnings (PE) ratio is a widely used and reliable metric for profitable companies like Aflac. By comparing the stock price to its earnings, investors get a quick sense of how much they are paying for each dollar of profit generated. This approach is especially relevant for established firms where consistent profitability, rather than rapid revenue expansion, drives valuation.
The “right” PE ratio for a company is not one-size-fits-all. Higher growth potential or lower risk often justifies a higher multiple, while slow-growing or riskier companies typically trade at lower PE ratios. Both sector norms and unique company attributes influence what is considered a fair value.
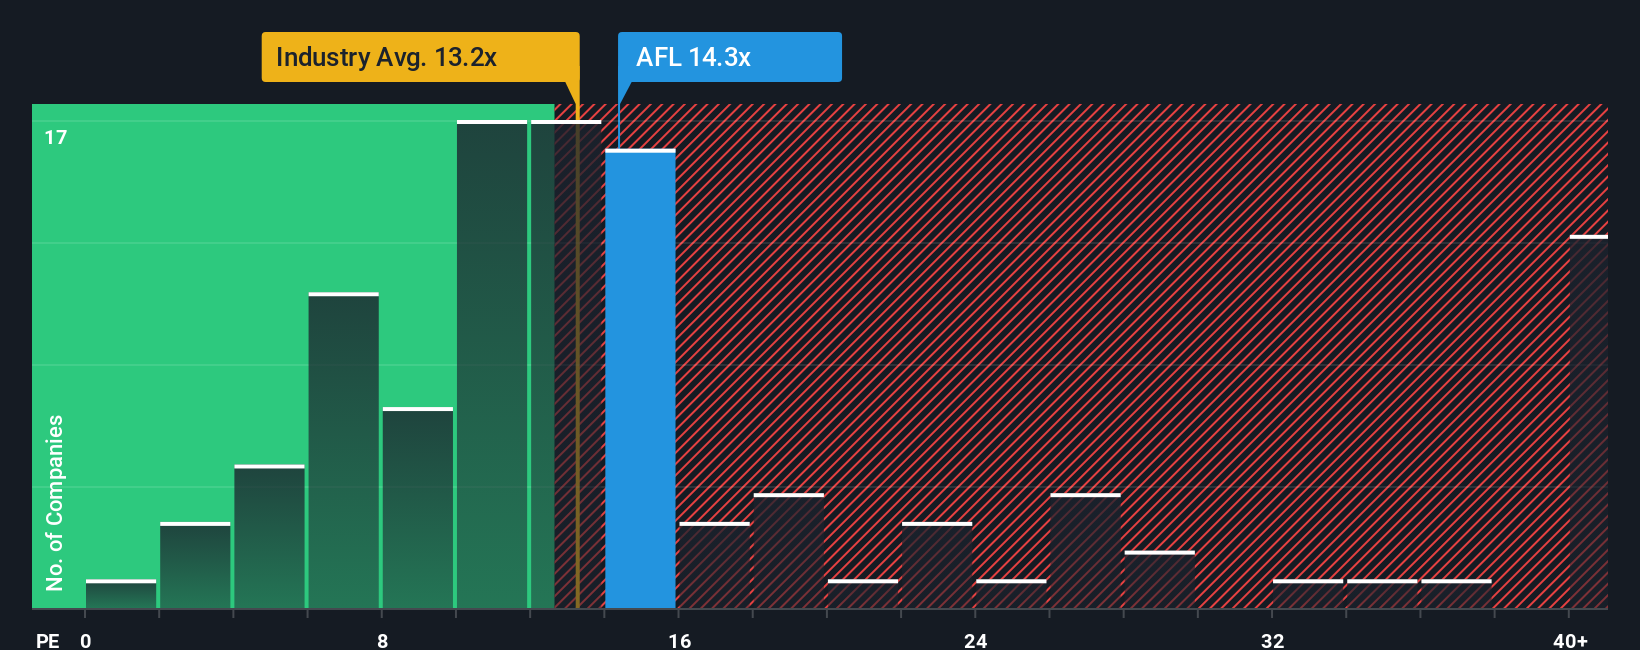
Aflac’s current PE ratio is 14.34x, just above the insurance industry average of 13.18x and its peers’ average of 13.52x. However, Simply Wall St’s proprietary “Fair Ratio” for Aflac is 12.11x. Unlike simple peer or sector comparisons, the Fair Ratio incorporates factors such as earnings growth, profitability, risk profile, industry position, and even market cap, to produce a more tailored expectation of value.
When we compare Aflac’s current PE ratio with its Fair Ratio, the difference is 2.23x. This suggests the stock is trading at a premium relative to where it is expected to be. By this measure, Aflac appears slightly overvalued based on its fundamentals.
Result: OVERVALUED
PE ratios tell one story, but what if the real opportunity lies elsewhere? Discover 1404 companies where insiders are betting big on explosive growth.
Upgrade Your Decision Making: Choose your Aflac Narrative
Earlier, we hinted at a better way to make investment decisions than relying solely on valuation ratios, so let’s introduce Narratives. A Narrative is simply the story or perspective you bring to a company, transforming the raw numbers such as your own assumptions about fair value, future revenue, earnings, and profit margins into a clear investment thesis with context.
Narratives link the company’s fundamental business story to a specific financial forecast and ultimately to what you believe is its fair value. Think of Narratives as a tool that helps you turn your research and beliefs into actionable insights, so you can easily compare your view with others and clearly see when the current price lines up with (or differs from) your own estimate of fair value.
On Simply Wall St’s Community page, creating or reviewing Narratives is straightforward and interactive, and used by millions already. Narratives adapt dynamically when new data, such as earnings releases or company news, emerge, ensuring your perspective is always up-to-date.
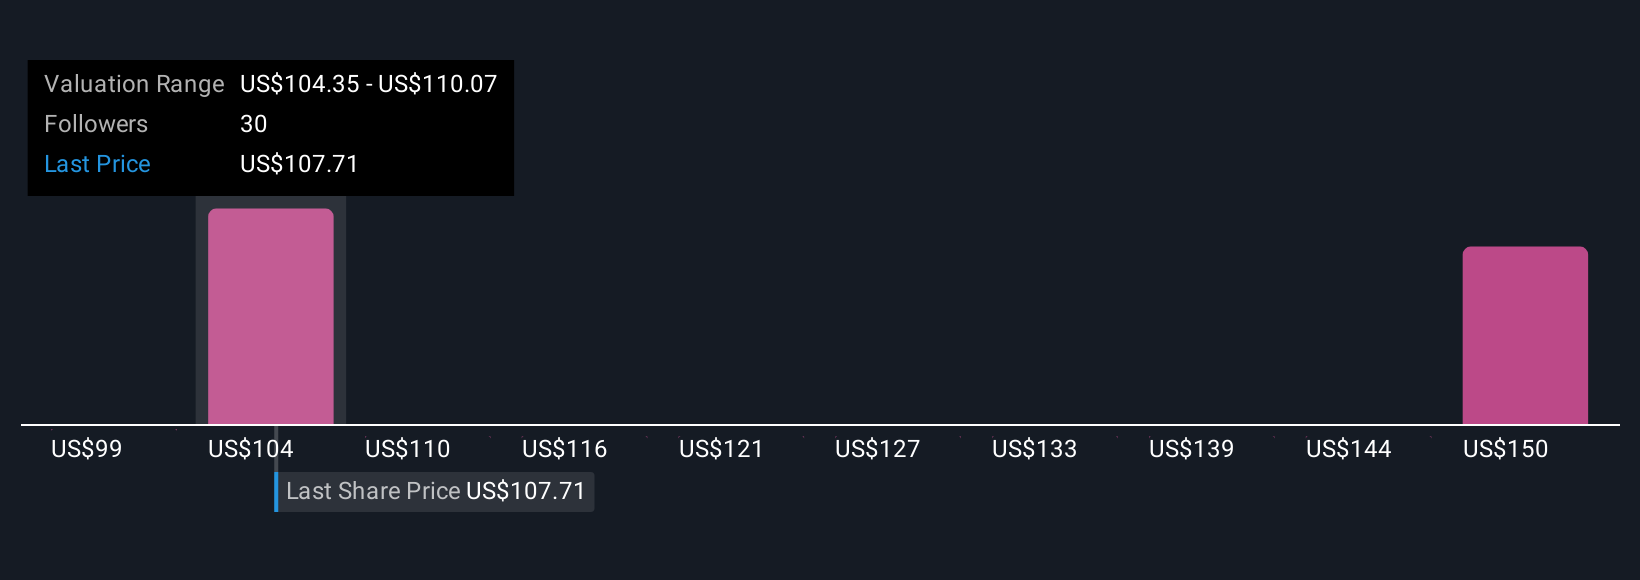
For example, with Aflac, one investor might see the company’s ambitious digital expansion and strong Japanese performance, targeting a fair value of $124 per share. Another might focus on slow US sales and currency risks and estimate fair value at $99. Both are valid Narratives, and using them helps make smarter decisions on whether to buy, hold, or sell.
Do you think there's more to the story for Aflac? Head over to our Community to see what others are saying!
This article by Simply Wall St is general in nature. We provide commentary based on historical data and analyst forecasts only using an unbiased methodology and our articles are not intended to be financial advice. It does not constitute a recommendation to buy or sell any stock, and does not take account of your objectives, or your financial situation. We aim to bring you long-term focused analysis driven by fundamental data. Note that our analysis may not factor in the latest price-sensitive company announcements or qualitative material. Simply Wall St has no position in any stocks mentioned.
New: Manage All Your Stock Portfolios in One Place
We've created the ultimate portfolio companion for stock investors, and it's free.
• Connect an unlimited number of Portfolios and see your total in one currency
• Be alerted to new Warning Signs or Risks via email or mobile
• Track the Fair Value of your stocks
Have feedback on this article? Concerned about the content? Get in touch with us directly. Alternatively, email editorial-team@simplywallst.com
About NYSE:AFL
Aflac
Through its subsidiaries, provides supplemental health and life insurance products.
Established dividend payer with acceptable track record.
Similar Companies
Market Insights

Advertisement
Community Narratives
The company that turned a verb into a global necessity and basically runs the modern internet, digital ads, smartphones, maps, and AI.
Fair Value US$300.00|7.1% undervalued
OS
Community Contributor
Flowers Foods Pays A Fair Price For Health
Fair Value US$16.12|26.4% undervalued
NV
Community Contributor
TMX Group will thrive with 33.3% profit margin and enduring market moat
Fair Value CA$49.90|0.8% overvalued
LI
Community Contributor
The "Molecular Pencil": Why Beam's Technology is Built to Win
Fair Value US$65.01|65.8% undervalued
DA
Community Contributor