Advertisement
- United States
- /
- Insurance
- /
- NasdaqGS:SAFT
Safety Insurance Group (SAFT): Assessing Valuation Following Strong Earnings and Dividend Reaffirmation

Simply Wall St
Reviewed by Simply Wall St
Safety Insurance Group (SAFT) just announced higher revenue and net income for both the third quarter and the past nine months compared to last year. The company also affirmed its quarterly dividend for shareholders.
See our latest analysis for Safety Insurance Group.
The recent string of good news, including a reaffirmed dividend and robust earnings growth, appears to have reinvigorated sentiment around Safety Insurance Group. After a tough start to the year, the company’s 7-day share price return of 13.03% and 30-day gain of 11.62% point to momentum building again. Even though the 1-year total shareholder return remains slightly negative, investors with a longer lens are faring better, with a 5-year total return of 27.51%.
If dividend stability and earnings rebounds have you rethinking your watchlist, now is a great time to broaden your search and discover fast growing stocks with high insider ownership
With shares rebounding and fundamentals improving, the real question is whether Safety Insurance Group is now an undervalued pick for investors, or if the latest gains already reflect all the company’s growth potential.
Price-to-Earnings of 13.2x: Is it justified?
Safety Insurance Group currently trades at a price-to-earnings (P/E) ratio of 13.2x, which is lower than the US market average and matches the insurance industry norm. At its last close of $77.12, this multiple hints at more measured market expectations compared to peers trading at much higher averages.
The price-to-earnings ratio reflects how much investors are willing to pay for each dollar of the company’s earnings. It is a common benchmark for insurers and highlights market sentiment about growth, stability, and risk within the sector.
For Safety Insurance Group, the P/E ratio of 13.2x sits well below the peer average of 33x but matches the broader industry’s standard of 13.2x. This suggests that while the company is not commanding a premium, the market might be discounting its profit growth prospects or future potential relative to select rivals. Investors should note that despite its in-line industry valuation, this discount to peers could shift if growth expectations change.
See what the numbers say about this price — find out in our valuation breakdown.
Result: Price-to-Earnings of 13.2x (ABOUT RIGHT)
However, persistent negative one-year returns and ongoing underperformance compared to analyst targets could present a challenge to the recent optimism surrounding Safety Insurance Group.
Find out about the key risks to this Safety Insurance Group narrative.
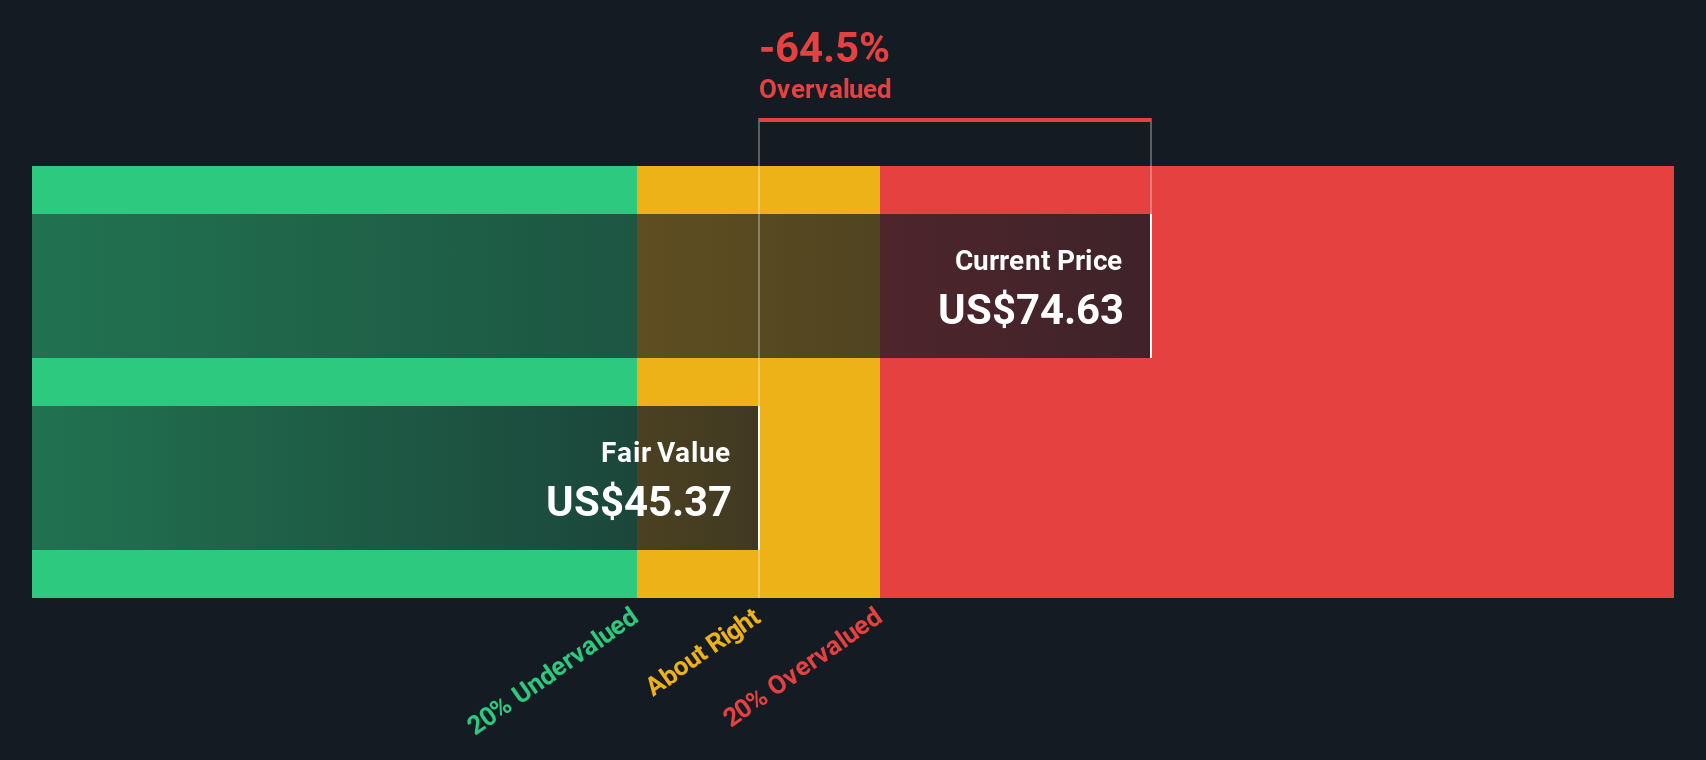
Another View: Discounted Cash Flow Tells a Different Story
While Safety Insurance Group looks reasonably priced using its earnings multiple, our DCF model suggests a different picture. At a recent price of $77.12, the stock trades well above our fair value estimate of $45.37. This implies the market may be factoring in more optimism than the fundamentals support. Could the market be running ahead of itself, or is there more upside waiting to be unlocked?
Look into how the SWS DCF model arrives at its fair value.
Simply Wall St performs a discounted cash flow (DCF) on every stock in the world every day (check out Safety Insurance Group for example). We show the entire calculation in full. You can track the result in your watchlist or portfolio and be alerted when this changes, or use our stock screener to discover 863 undervalued stocks based on their cash flows. If you save a screener we even alert you when new companies match - so you never miss a potential opportunity.
Build Your Own Safety Insurance Group Narrative
If you’ve got a different perspective or want to dig into the numbers yourself, shaping your own view takes just a few minutes, so why not Do it your way
A great starting point for your Safety Insurance Group research is our analysis highlighting 3 key rewards and 1 important warning sign that could impact your investment decision.
Looking for more investment ideas?
Don’t let today’s market winners pass you by while you focus on just one company. Expand your strategy and hunt for tomorrow's opportunities with these unique ideas:
- Boost your portfolio’s growth potential by targeting these 863 undervalued stocks based on cash flows, which offers market-beating value based on strong cash flows and solid fundamentals.
- Tap into future healthcare breakthroughs by reviewing these 32 healthcare AI stocks, which leads innovation in diagnostics, patient care, and biopharma advancements.
- Position yourself at the forefront of blockchain disruption by checking out these 82 cryptocurrency and blockchain stocks, which is making waves in digital assets, financial security, and next-generation payments.
This article by Simply Wall St is general in nature. We provide commentary based on historical data and analyst forecasts only using an unbiased methodology and our articles are not intended to be financial advice. It does not constitute a recommendation to buy or sell any stock, and does not take account of your objectives, or your financial situation. We aim to bring you long-term focused analysis driven by fundamental data. Note that our analysis may not factor in the latest price-sensitive company announcements or qualitative material. Simply Wall St has no position in any stocks mentioned.
New: Manage All Your Stock Portfolios in One Place
We've created the ultimate portfolio companion for stock investors, and it's free.
• Connect an unlimited number of Portfolios and see your total in one currency
• Be alerted to new Warning Signs or Risks via email or mobile
• Track the Fair Value of your stocks
Have feedback on this article? Concerned about the content? Get in touch with us directly. Alternatively, email editorial-team@simplywallst.com
About NasdaqGS:SAFT
Safety Insurance Group
Provides private passenger and commercial automobile, and homeowner insurance in the United States.
6 star dividend payer with excellent balance sheet.
Similar Companies
Market Insights

Advertisement
Community Narratives
The "Molecular Pencil": Why Beam's Technology is Built to Win
Fair Value US$65.01|66.7% undervalued
DA
Community Contributor
The silent giant behind virtually every advanced chip powering AI, smartphones, and modern infrastructure.
Fair Value US$310.00|4.8% undervalued
OS
Community Contributor
ADP Stock: Solid Fundamentals, But AI Investments Test Its Margin Resilience
Fair Value US$387.77|34.5% undervalued
YI
Community Contributor
MINISO's fair value is projected at 26.69 with an anticipated PE ratio shift of 20x
Fair Value US$24.03|9.6% undervalued
BE
Community Contributor