- United States
- /
- Insurance
- /
- NasdaqGS:ERIE
Are Strong Financial Prospects The Force That Is Driving The Momentum In Erie Indemnity Company's NASDAQ:ERIE) Stock?


Erie Indemnity (NASDAQ:ERIE) has had a great run on the share market with its stock up by a significant 46% over the last three months. Since the market usually pay for a company’s long-term fundamentals, we decided to study the company’s key performance indicators to see if they could be influencing the market. In this article, we decided to focus on Erie Indemnity's ROE.
Return on Equity or ROE is a test of how effectively a company is growing its value and managing investors’ money. Simply put, it is used to assess the profitability of a company in relation to its equity capital.
View our latest analysis for Erie Indemnity
How To Calculate Return On Equity?
The formula for ROE is:
Return on Equity = Net Profit (from continuing operations) ÷ Shareholders' Equity
So, based on the above formula, the ROE for Erie Indemnity is:
29% = US$530m ÷ US$1.8b (Based on the trailing twelve months to June 2024).
The 'return' is the yearly profit. Another way to think of that is that for every $1 worth of equity, the company was able to earn $0.29 in profit.
What Is The Relationship Between ROE And Earnings Growth?
We have already established that ROE serves as an efficient profit-generating gauge for a company's future earnings. Depending on how much of these profits the company reinvests or "retains", and how effectively it does so, we are then able to assess a company’s earnings growth potential. Assuming all else is equal, companies that have both a higher return on equity and higher profit retention are usually the ones that have a higher growth rate when compared to companies that don't have the same features.
Erie Indemnity's Earnings Growth And 29% ROE
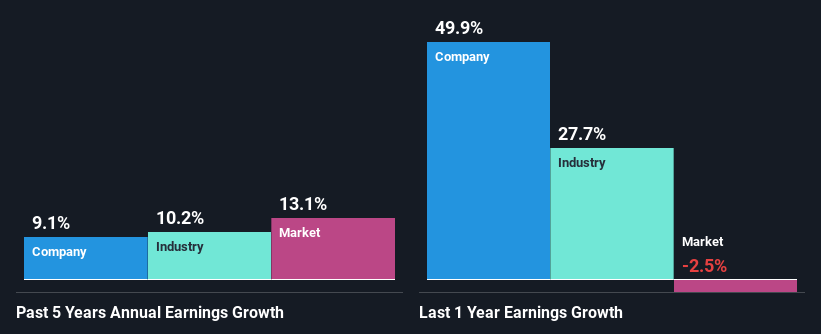
First thing first, we like that Erie Indemnity has an impressive ROE. Second, a comparison with the average ROE reported by the industry of 13% also doesn't go unnoticed by us. Probably as a result of this, Erie Indemnity was able to see a decent net income growth of 9.1% over the last five years.
We then performed a comparison between Erie Indemnity's net income growth with the industry, which revealed that the company's growth is similar to the average industry growth of 10% in the same 5-year period.
The basis for attaching value to a company is, to a great extent, tied to its earnings growth. The investor should try to establish if the expected growth or decline in earnings, whichever the case may be, is priced in. This then helps them determine if the stock is placed for a bright or bleak future. If you're wondering about Erie Indemnity's's valuation, check out this gauge of its price-to-earnings ratio, as compared to its industry.
Is Erie Indemnity Efficiently Re-investing Its Profits?
While Erie Indemnity has a three-year median payout ratio of 67% (which means it retains 33% of profits), the company has still seen a fair bit of earnings growth in the past, meaning that its high payout ratio hasn't hampered its ability to grow.
Additionally, Erie Indemnity has paid dividends over a period of at least ten years which means that the company is pretty serious about sharing its profits with shareholders.
Summary
Overall, we are quite pleased with Erie Indemnity's performance. In particular, its high ROE is quite noteworthy and also the probable explanation behind its considerable earnings growth. Yet, the company is retaining a small portion of its profits. Which means that the company has been able to grow its earnings in spite of it, so that's not too bad. Having said that, looking at the current analyst estimates, we found that the company's earnings are expected to gain momentum. To know more about the latest analysts predictions for the company, check out this visualization of analyst forecasts for the company.
Valuation is complex, but we're here to simplify it.
Discover if Erie Indemnity might be undervalued or overvalued with our detailed analysis, featuring fair value estimates, potential risks, dividends, insider trades, and its financial condition.
Access Free AnalysisHave feedback on this article? Concerned about the content? Get in touch with us directly. Alternatively, email editorial-team (at) simplywallst.com.
This article by Simply Wall St is general in nature. We provide commentary based on historical data and analyst forecasts only using an unbiased methodology and our articles are not intended to be financial advice. It does not constitute a recommendation to buy or sell any stock, and does not take account of your objectives, or your financial situation. We aim to bring you long-term focused analysis driven by fundamental data. Note that our analysis may not factor in the latest price-sensitive company announcements or qualitative material. Simply Wall St has no position in any stocks mentioned.
About NasdaqGS:ERIE
Erie Indemnity
Operates as a managing attorney-in-fact for the subscribers at the Erie Insurance Exchange in the United States.
Outstanding track record with flawless balance sheet and pays a dividend.

