Advertisement
- United States
- /
- Healthcare Services
- /
- NYSEAM:NHC
How National HealthCare’s Senior Care Expansion Impacts Valuation After 18.5% Year-to-Date Rally

Simply Wall St
Reviewed by Bailey Pemberton
- Wondering if National HealthCare is a bargain or priced for perfection? Let’s dig into what’s driving the value of this long-established healthcare name.
- The stock has climbed an impressive 18.5% year-to-date, despite some recent volatility. This suggests that investors are both optimistic and newly attentive to potential risks.
- National HealthCare has hit headlines lately after expanding its network of senior care facilities and pushing forward with strategic partnerships. These moves have contributed to renewed market interest. These developments are fueling speculation about how its growth initiatives could shape future earnings and overall market positioning.
- Drilling down to the numbers, the company notches a 3 out of 6 on our valuation scorecard, signaling a mix of strengths and caution flags. Next, we’ll walk through a few common valuation checks to wrap up with a technique that may change how you read a number like that.
Approach 1: National HealthCare Discounted Cash Flow (DCF) Analysis
A Discounted Cash Flow (DCF) model estimates a company's value by projecting its future cash flows and discounting them back to their value in today's dollars. This approach offers insight into what National HealthCare (NYSEAM:NHC) is really worth based on expected future performance.
For National HealthCare, the DCF analysis begins with its latest reported Free Cash Flow (FCF) of $146.89 million. Over the coming decade, these annual cash flows are projected to grow at varying rates, with analyst-based estimates reaching five years out and Simply Wall St extending these forecasts for an additional five years. By 2035, cash flow is projected to reach $397.03 million, reflecting a trajectory that slows gradually through the latter years as growth rates taper from 26.1% to around 4%.
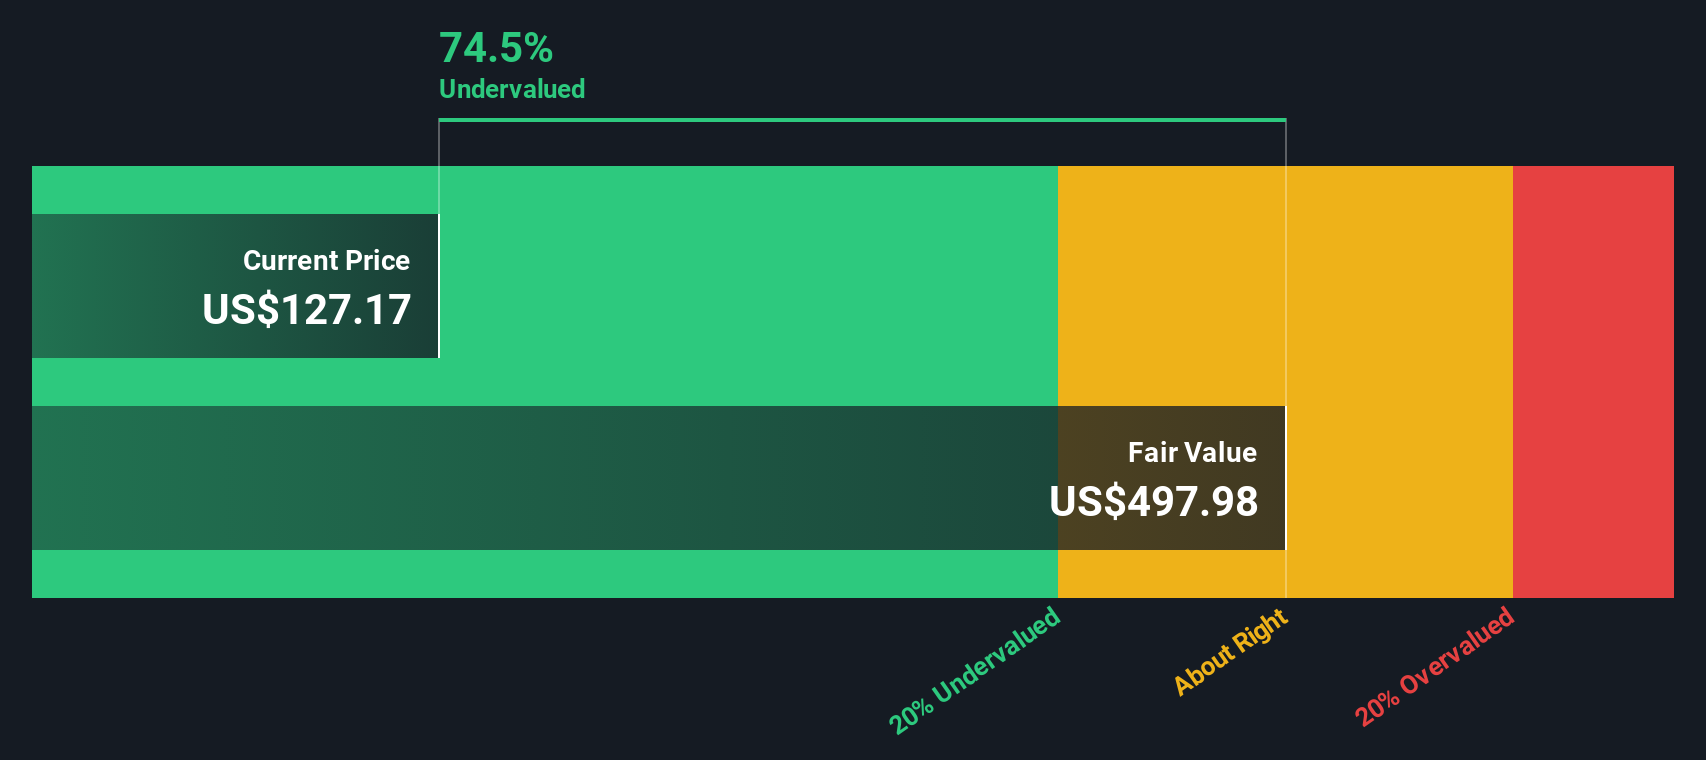
Based on this model, the estimated intrinsic value per share comes out to $497.98. That suggests National HealthCare trades at a 74.7% discount to its DCF-derived fair value. In other words, this indicates the stock may be significantly undervalued relative to its long-term cash flow prospects.
Result: UNDERVALUED
Our Discounted Cash Flow (DCF) analysis suggests National HealthCare is undervalued by 74.7%. Track this in your watchlist or portfolio, or discover 897 more undervalued stocks based on cash flows.
Approach 2: National HealthCare Price vs Earnings
For companies with consistent profitability, the price-to-earnings (PE) ratio is often a preferred metric. It gives investors a simple way to gauge how much they are paying for each dollar of earnings and is particularly useful for established businesses like National HealthCare.
A company’s PE ratio is shaped by expectations for growth and its overall risk profile. Generally, a higher growth outlook or lower risk will justify a higher PE ratio, while concerns about future performance or industry headwinds tend to push the PE lower. This context is key to understanding whether a current PE is high, low, or justifiable.
National HealthCare currently trades at a PE ratio of 19.33x. Comparing this to benchmarks, the stock sits above the peer group average of 15.73x but remains below the healthcare industry average of 21.48x. These basic comparisons offer some perspective, but they do not account for unique qualities such as the company’s earnings stability, profit margins, and specific growth outlook.
That is where Simply Wall St’s “Fair Ratio” comes in. This proprietary measure determines what PE is reasonable based on a deeper look at the company’s profitability, growth, risks, industry position, and even its market cap. Unlike basic peer or sector comparisons, the Fair Ratio reflects the broader context that can move the needle on valuation.
By lining up National HealthCare’s current PE against its Fair Ratio, investors get a more holistic valuation check. In this case, the current PE is neither too stretched nor heavily discounted compared to what is expected for a business of its profile and prospects, suggesting the valuation is about right for now.
Result: ABOUT RIGHT

PE ratios tell one story, but what if the real opportunity lies elsewhere? Discover 1416 companies where insiders are betting big on explosive growth.
Upgrade Your Decision Making: Choose your National HealthCare Narrative
Earlier we mentioned that there's an even better way to understand valuation, so let's introduce you to Narratives. Put simply, a Narrative is your personal story about a company, backed by the numbers you believe in, such as your own fair value, revenue estimates, and margin assumptions. Narratives are powerful because they connect the real-life story of National HealthCare to a forecast of future financials, letting you see exactly how your expectations map to what you think the stock is worth.
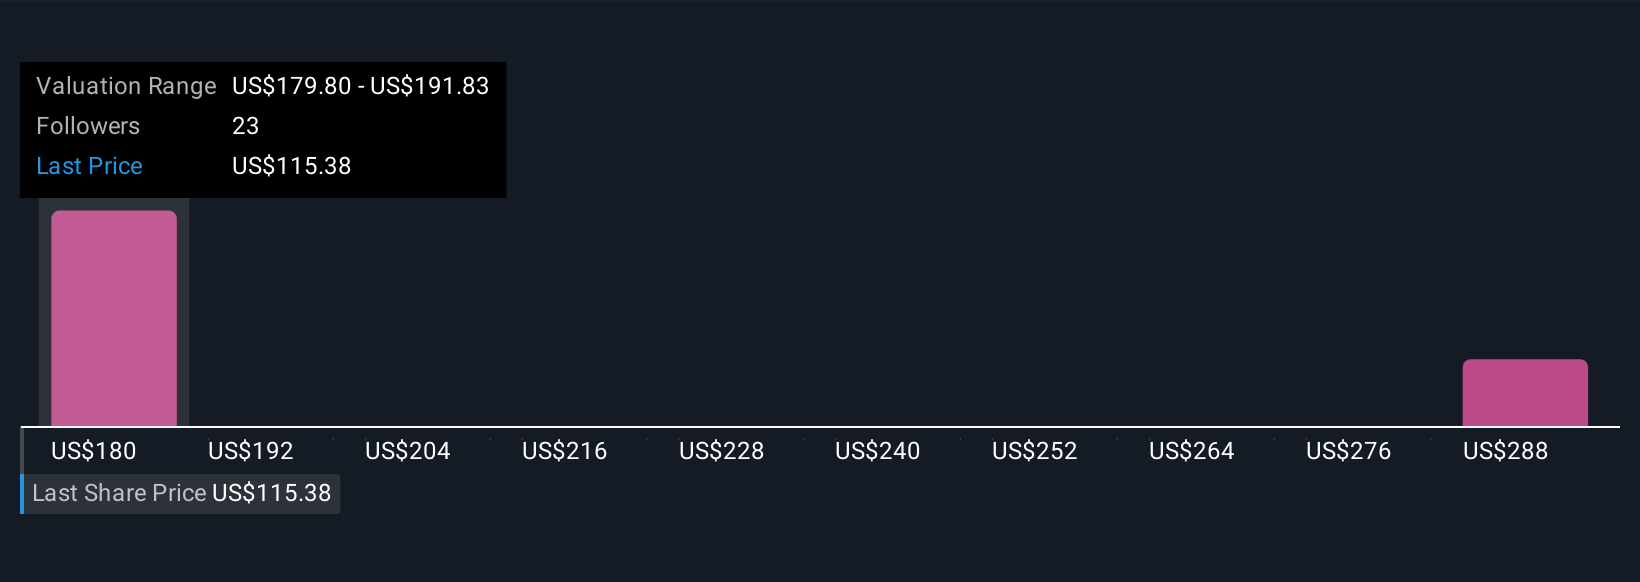
On Simply Wall St’s Community page, Narratives are easy for anyone to use and update, making them a practical tool used by millions of investors. With Narratives, you can quickly decide when to buy or sell by comparing your Fair Value with the market Price. In addition, your valuations will update automatically when news or earnings change the story. For example, one National HealthCare Narrative sees a strong recovery, predicting a P/E expansion and a fair value of $179.80 per share, while another takes a more cautious view, holding steady at a P/E of 15.9. This shows how your unique perspective can drive a smarter, more responsive investing process.
Do you think there's more to the story for National HealthCare? Head over to our Community to see what others are saying!
This article by Simply Wall St is general in nature. We provide commentary based on historical data and analyst forecasts only using an unbiased methodology and our articles are not intended to be financial advice. It does not constitute a recommendation to buy or sell any stock, and does not take account of your objectives, or your financial situation. We aim to bring you long-term focused analysis driven by fundamental data. Note that our analysis may not factor in the latest price-sensitive company announcements or qualitative material. Simply Wall St has no position in any stocks mentioned.
Valuation is complex, but we're here to simplify it.
Discover if National HealthCare might be undervalued or overvalued with our detailed analysis, featuring fair value estimates, potential risks, dividends, insider trades, and its financial condition.
Access Free AnalysisHave feedback on this article? Concerned about the content? Get in touch with us directly. Alternatively, email editorial-team@simplywallst.com
About NYSEAM:NHC
National HealthCare
Engages in the operation of services to skilled nursing facilities, assisted and independent living facilities, homecare and hospice agencies, and health hospitals.
Excellent balance sheet established dividend payer.
Similar Companies
Market Insights

Advertisement
Community Narratives
MicroVision will explode future revenue by 380.37% with a vision towards success
Fair Value US$60.00|98.5% undervalued
TH
Community Contributor
The Indispensable Artery for a New North American Economy
Fair Value CA$132.87|2.3% undervalued
TI
Community Contributor