Advertisement
- United States
- /
- Healthcare Services
- /
- NYSE:PACS
PACS Group (PACS): Valuation Check as Forbearance Extension Buys Time for Regulatory and Financial Progress

Simply Wall St
Reviewed by Simply Wall St
PACS Group (PACS) announced that it has secured an extension of its forbearance agreements with lenders, giving the company more time to address financial and regulatory hurdles. This move is closely connected to its efforts to regain NYSE compliance.
See our latest analysis for PACS Group.
PACS Group’s string of regulatory challenges and the recent forbearance extension come as the company’s share price continues to reflect uncertainty, with a 1-year total shareholder return of -37.07%. Despite short-term improvement over the past 90 days, lasting momentum remains elusive for now as investors await clearer signals on compliance progress and business fundamentals.
If you’re watching PACS Group and want fresh ideas, now is a smart moment to broaden your search and discover See the full list for free.
With PACS Group trading at a sharp discount to analyst price targets despite recent growth in revenue and net income, the question remains: Is the market overlooking hidden value, or is future uncertainty already priced in?
Price-to-Earnings of 21x: Is It Justified?
PACS Group is trading at a price-to-earnings (P/E) ratio of 21x, just below the US Healthcare industry average of 21.5x. With its last close price at $12.48, the multiple indicates that the market currently prices PACS much like its sector peers, despite the sizable discount to analyst targets.
The price-to-earnings ratio is a widely used metric that shows how much investors are willing to pay for every dollar of earnings. In healthcare, where future growth and regulatory risks are key, a sector-aligned P/E suggests the market views PACS as a typical player with neither excessive optimism nor deep concern.
On closer inspection, the P/E of 21x is supported by PACS’s strong revenue growth, high quality earnings, and a reputable board. Yet, compared to its estimated fair P/E ratio of 43.5x, the current multiple could be considered conservative. Should sentiment or fundamentals shift, the market could re-rate PACS toward this higher benchmark.
Explore the SWS fair ratio for PACS Group
Result: Price-to-Earnings of 21x (ABOUT RIGHT)
However, risks remain if regulatory hurdles linger or if short-term market sentiment worsens. Both of these factors could challenge recent financial gains and market optimism.
Find out about the key risks to this PACS Group narrative.
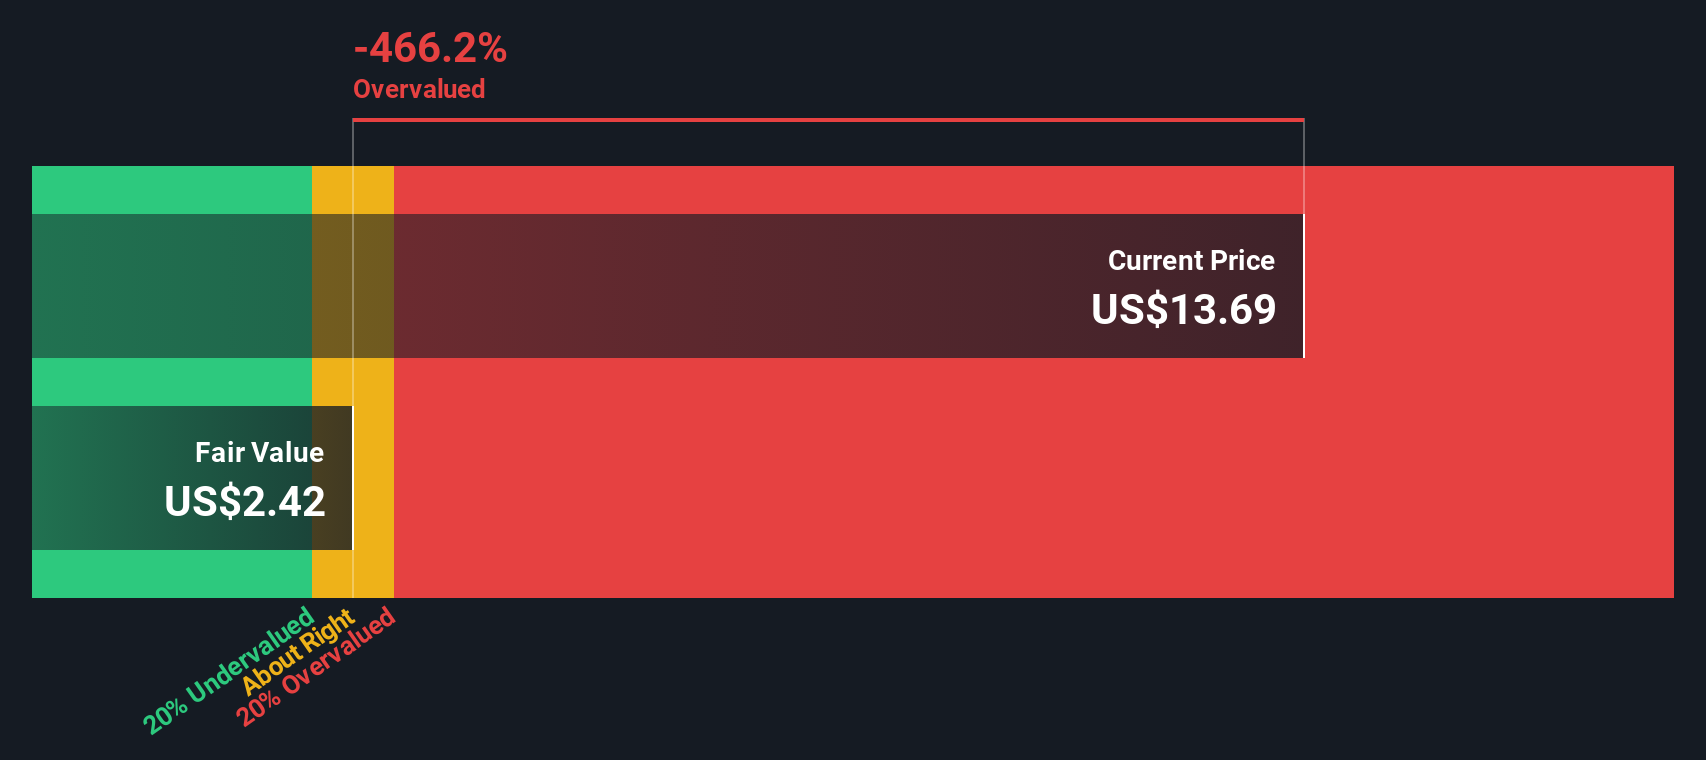
Another View: The SWS DCF Model Perspective
While PACS’s price-to-earnings ratio suggests shares are attractively valued against industry averages and even its fair ratio, our DCF model offers a different perspective. According to this method, PACS is trading well above its estimated fair value, which implies the current price may overstate the company’s future cash flow potential. Does this mean recent optimism is misplaced, or is the DCF model too conservative for PACS’s story?
Look into how the SWS DCF model arrives at its fair value.
Simply Wall St performs a discounted cash flow (DCF) on every stock in the world every day (check out PACS Group for example). We show the entire calculation in full. You can track the result in your watchlist or portfolio and be alerted when this changes, or use our stock screener to discover 860 undervalued stocks based on their cash flows. If you save a screener we even alert you when new companies match - so you never miss a potential opportunity.
Build Your Own PACS Group Narrative
If you see things differently or want to dig into the numbers yourself, you can shape your own view in just a few minutes. Do it your way
A great starting point for your PACS Group research is our analysis highlighting 4 key rewards and 4 important warning signs that could impact your investment decision.
Looking for more investment ideas?
Smart investors never settle for just one stock. You could be missing out on undervalued gems or tomorrow’s sector leaders if you stop here. Go beyond PACS Group and supercharge your search. Your next big winner might already be waiting.
- Capitalize on the surge in artificial intelligence by checking out these 24 AI penny stocks. These companies are transforming industries with machine learning, automation, and data-driven innovation.
- Lock in stable income and steady growth when you examine these 17 dividend stocks with yields > 3%. These options offer reliable yields above 3% and strong business fundamentals.
- Get ahead of Wall Street by scouting these 860 undervalued stocks based on cash flows, where the market may be overlooking significant upside based on cash flow potential.
This article by Simply Wall St is general in nature. We provide commentary based on historical data and analyst forecasts only using an unbiased methodology and our articles are not intended to be financial advice. It does not constitute a recommendation to buy or sell any stock, and does not take account of your objectives, or your financial situation. We aim to bring you long-term focused analysis driven by fundamental data. Note that our analysis may not factor in the latest price-sensitive company announcements or qualitative material. Simply Wall St has no position in any stocks mentioned.
New: Manage All Your Stock Portfolios in One Place
We've created the ultimate portfolio companion for stock investors, and it's free.
• Connect an unlimited number of Portfolios and see your total in one currency
• Be alerted to new Warning Signs or Risks via email or mobile
• Track the Fair Value of your stocks
Have feedback on this article? Concerned about the content? Get in touch with us directly. Alternatively, email editorial-team@simplywallst.com
About NYSE:PACS
PACS Group
Through its subsidiaries, operates skilled nursing facilities and assisted living facilities in the United States.
Reasonable growth potential with slight risk.
Similar Companies
Market Insights

Advertisement
Community Narratives
The company that turned a verb into a global necessity and basically runs the modern internet, digital ads, smartphones, maps, and AI.
Fair Value US$300.00|5.1% undervalued
OS
Community Contributor
Flowers Foods Pays A Fair Price For Health
Fair Value US$16.12|27.7% undervalued
NV
Community Contributor
TMX Group will thrive with 33.3% profit margin and enduring market moat
Fair Value CA$49.90|0.2% overvalued
LI
Community Contributor
The "Molecular Pencil": Why Beam's Technology is Built to Win
Fair Value US$65.01|64.4% undervalued
DA
Community Contributor